Planning
This view allows detailed planning of the time schedule of the active project, as well as allocation of efforts to human resources from the HRM module.
The workspace of this view contains the so-called Gantt chart. This chart graphically represents the processes in the project on a time axis. The Gantt chart consists of three parts, namely the work breakdown structure, a customizable table and the actual Gantt chart. In the Options Area there are further options for the detailed planning of resources and TODOs.
Building blocks
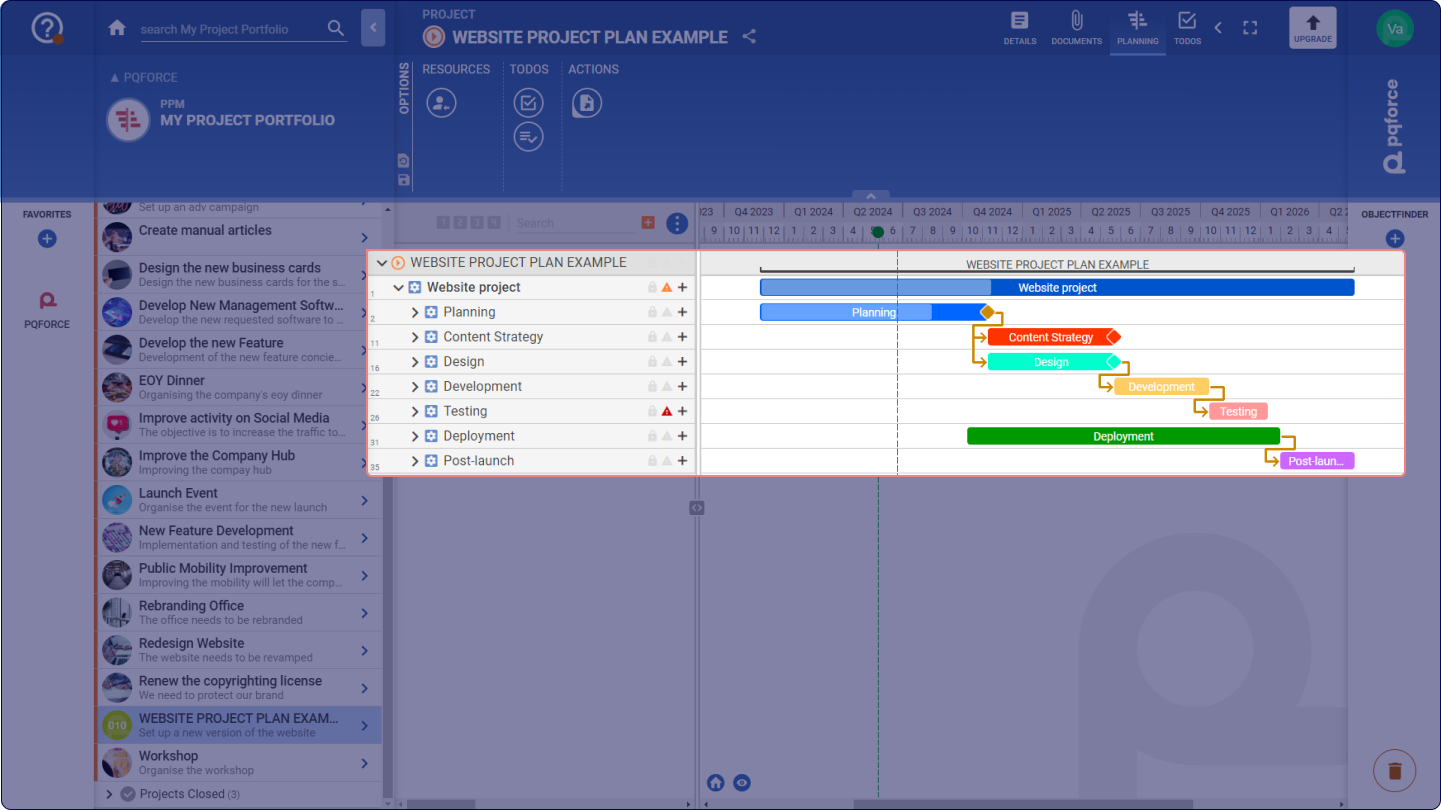
The PLANNING view comprises several blocks, including:
-
Tasks, which are components existing exclusively within a project. Each task has a start and end date, representing its duration. They map activities within projects. Efforts can be planned, and people can be assigned to tasks. This is called allocation.
-
Milestones, essential tasks marked solely by a start date without any associated duration. They are used to represent events in the project that are limited to a point in time. Milestones are often used to track goals or to map events. Milestones cannot be used to plan efforts.
-
Folders, used for the structural organization of tasks and milestones. They allow for the specification of a name, ID, and comment but lack any additional associated data. The available data is determined by the summation of data associated with the contained elements.
Side Tab
Tasks and milestones can be viewed and edited in the Side Tab. In particular, the efforts allocated to the tasks can be managed there. In the following section, we will discuss which options and editing possibilities are available in the Side Tab.
TASK
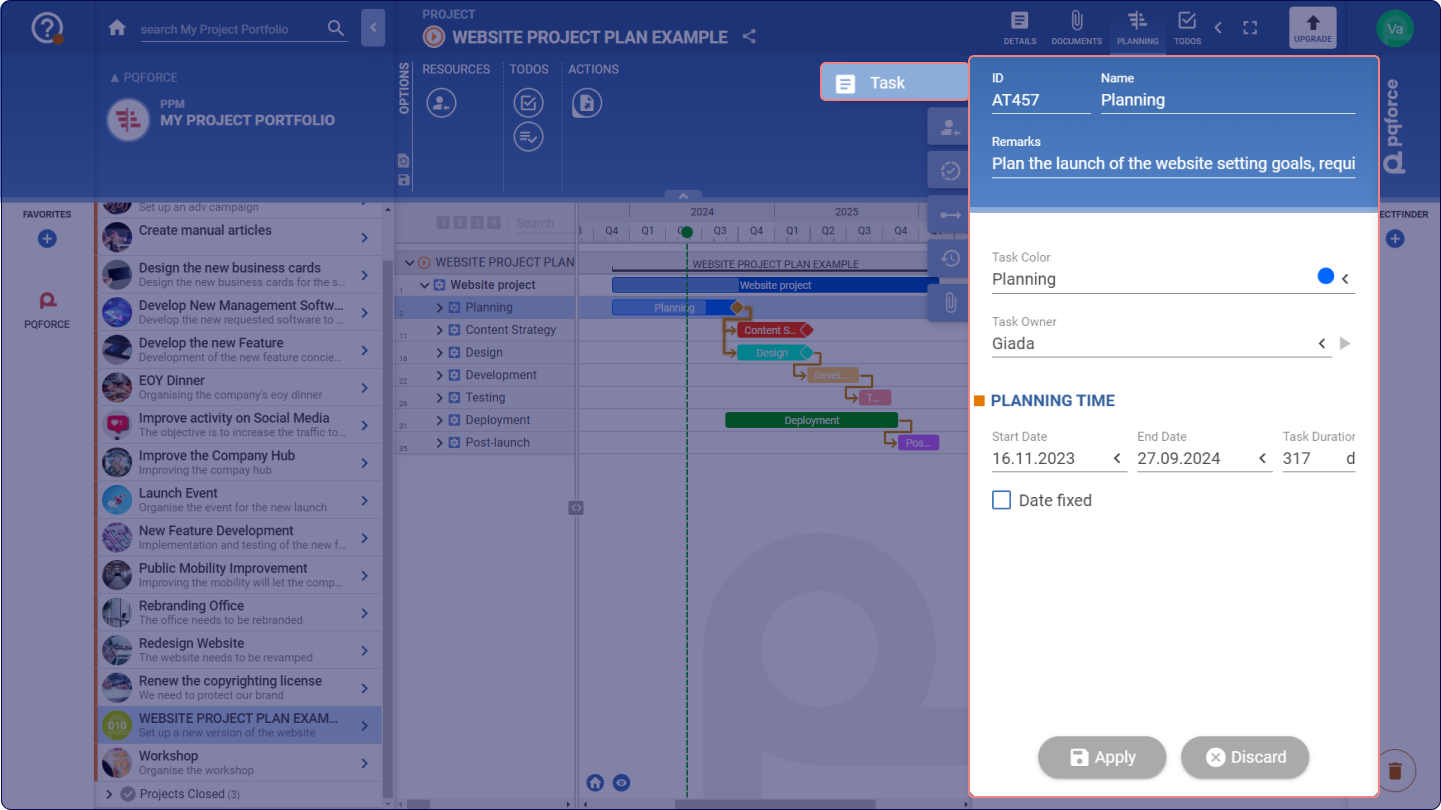
This tab corresponds to the DETAILS view of the task or milestone and contains its identifiers and the following properties:
-
ID: The ID is a sequence of characters that serves as an identifier of the task or milestone.
-
Name: This is the name of the Task or Milestone. It is used to distinguish the different tasks and milestones in the project.
-
Remarks: This is a text field in which a short comment about the task or milestone can be entered.
-
Task Colour: This selection field can be used to assign a colour to the task or milestone in order to visually mark or categorise it. The list of colours assigned to this selection field can be edited in the ADMIN module.
-
Task Owner (this option is available only for editions higher than PQFORCE Smart): Here, an employee can be entered as the task owner. The employee entered has editing rights for the corresponding task or milestone as well as for all tasks and milestones attached to it. If an owner is entered, a new browser tab can be opened by clicking on the gray arrow to the right of the field, in which it is possible to navigate directly to the employee.
-
Start Date: This is the start date of the task or milestone.
-
End Date: This is the end date of the task.
-
Task Duration: This is the duration of the task. It is directly dependent on the start and end dates.
-
If the duration is changed, the start date remains and the end date is adjusted.
-
If the end date is changed, the start date remains and the duration is adjusted.
-
If the start date is changed, the end date remains and the duration is adjusted.
-
In editions higher than PQFORCE Smart, if a Working Time model has been previously selected for the project, the task duration will only display the number of actual working days, excluding weekends and bank holidays.
-
Date fixed: With this check box, the dates of the task or milestone can be fixed. The date fields can thus no longer be edited and the task or milestone can no longer be shifted in time in the Gantt chart.
ALLOCATIONS or EFFORT
The outlook and features of the next Side Tab may differ depending on your PQFORCE edition.
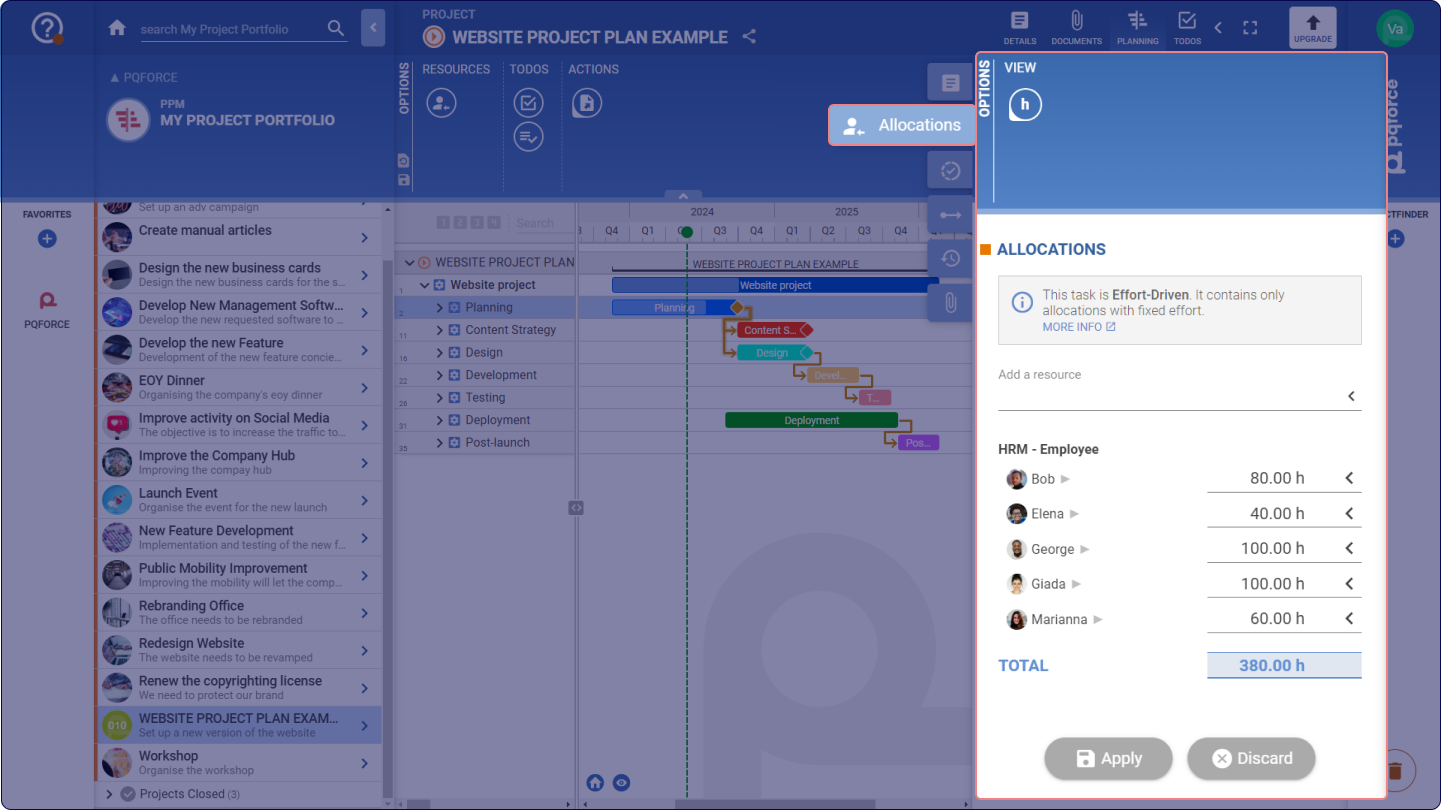
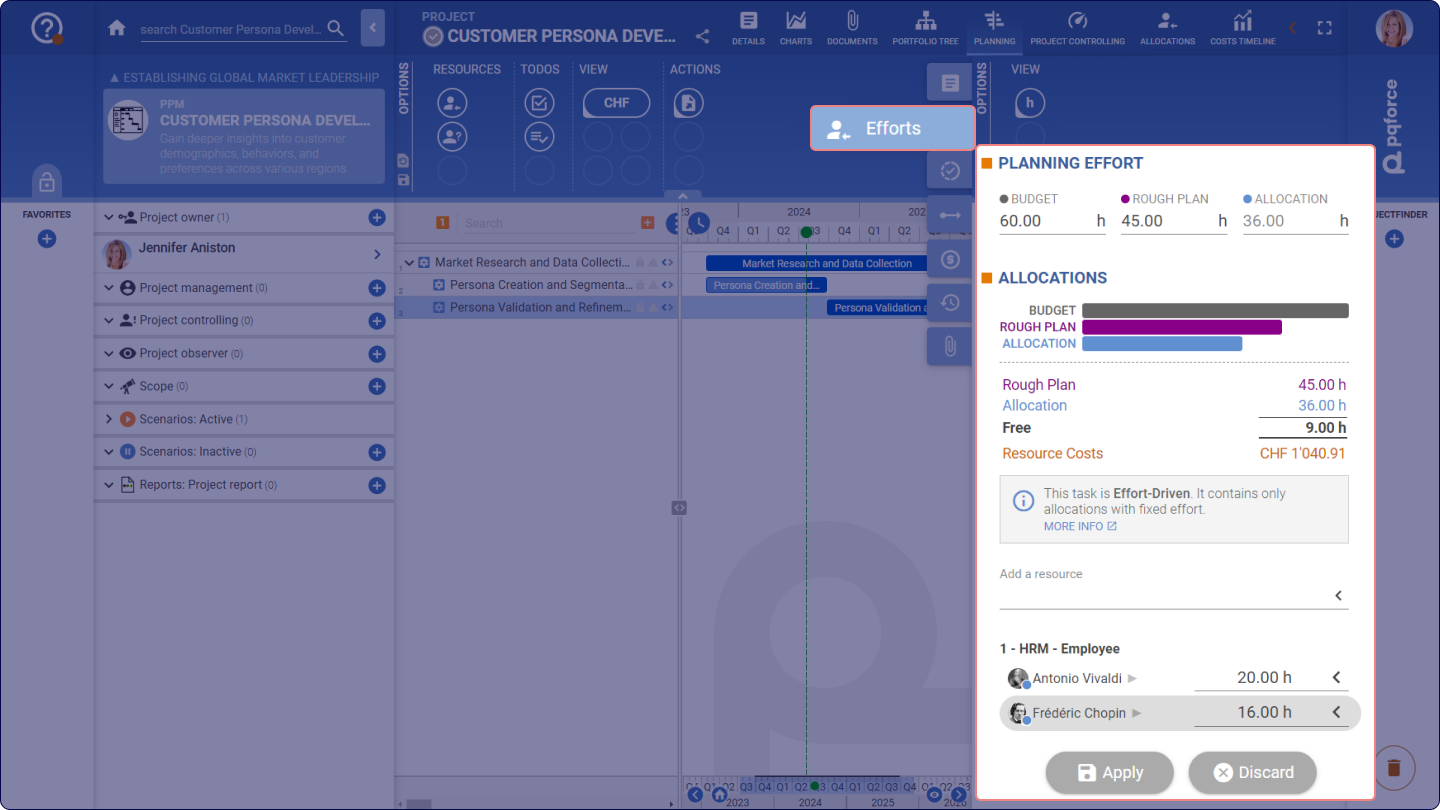
The PQFORCE Smart edition includes ALLOCATIONS Side Tab, where resources can be allocated to tasks. Higher editions include another Side Tab called EFFORTS where both efforts and allocations can be managed.
Effort-driven and time-driven tasks
Tasks are classified into effort-driven or time-driven based on their allocation types, which significantly impact progress assessment:
-
Effort-driven tasks focus on achieving specific outcomes within estimated absolute effort, resulting in variable resource utilisation depending on task deadlines. If the end date is postponed, resource utilisation decreases, while advancing the end date increases resource utilisation due to completing the same effort within a shorter timeframe.
-
Time-driven tasks prioritise completing tasks by specific end dates, maintaining constant resource utilisation per unit of time regardless of shifting deadlines. The absolute effort of the resources changes in this case when the end date is shifted: it increases if pushed into the future and decreases if the task's end is to be reached earlier. However, the resource utilisation per unit of time remains constant.
Add allocations
Under Add a resource, a resource can be selected from the organisation chart, which is then allocated to the task. Afterwards, a numeric value must be entered and the changes applied so that this allocation is saved and calculated in the workload. The total value of allocations is displayed beneath the allocated resources, and it will consider any allocation variations.
Edit allocations
Under Add a resource, a resource can be selected from the organisation chart, which is then allocated to the task. Afterwards, a numeric value must be entered and the changes applied so that this allocation is saved and calculated in the workload. The total value of allocations is displayed beneath the allocated resources, and it will consider any allocation variations.
The following units are available for selection:
-
H / D / W / M / Y: Changes the unit to hours / days / weeks / months / years. These are absolute units. The conversion rate from days to hours is controlled by the standard working time stored in the ADMIN module.
-
FTE: Changes the unit to Full Time Equivalent (FTE), which is a relative unit. One FTE corresponds to the standard working time stored in the ADMIN module, ignoring any specific changes in availability (e.g. absences or holidays).
-
% AV: Changes the unit to a percentage of the effective availability (% Availability) of the allocated resource, which corresponds to a relative unit. The availability of the resource can be changed by absences and holidays, as well as by the working time model. Any such changes will cause a corresponding change in the allocation in real time.
-
% PE: Changes the unit to a percentage of the planned effort (% Planned Effort) of the task, which corresponds to an absolute unit. If the planned effort is changed, the allocation will change accordingly.
Additional controls for setting allocated time include:
-
A slider with a handle for adjusting the allocated time.
-
The NONE button, which sets the allocation to zero.
-
The FREE button, which sets the allocation equal to the current free availability of the resource.
-
The ALL button, which sets the allocation equal to the total effective availability.
Delete allocations
An existing allocation can be deleted by dragging the name of the resource to the trash can. Alternatively, the value of the allocation can be set to zero. When applying the changes, the allocation will then be removed.
TIME UNIT
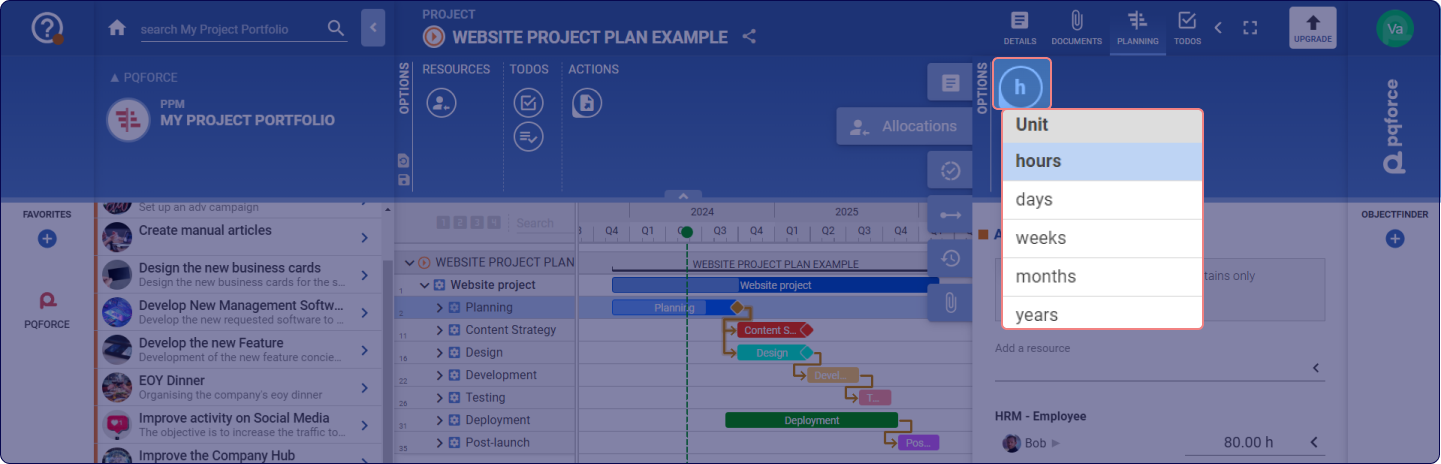
The time unit option enables the selection of a time unit for the total allocation value, ranging from hours, days, weeks, months, to years.
PROGRESS
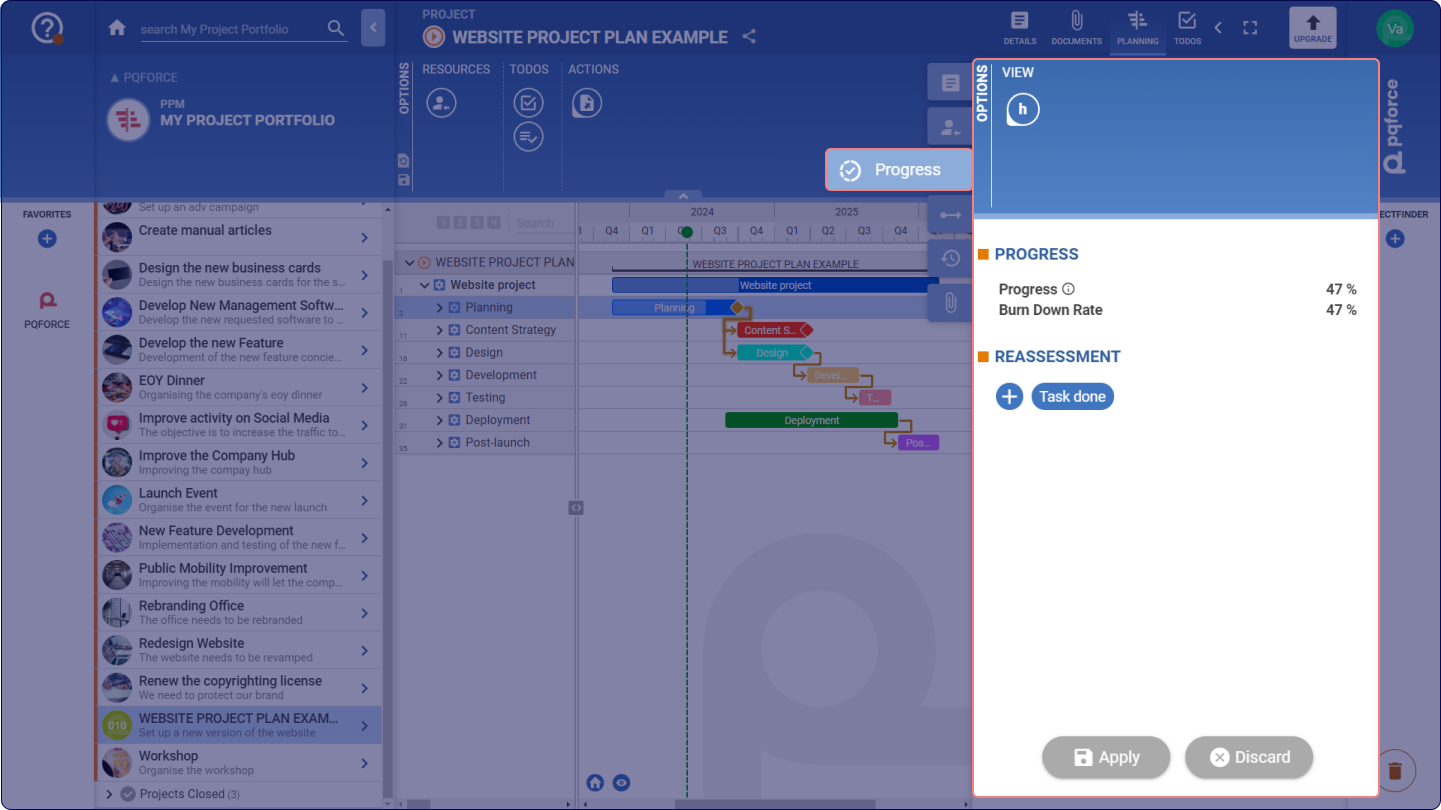
The Progress tab provides detailed information on the progress and reassessment options of the selected task.
Progress information
Progress information is automatically calculated by the system, based on task duration and time elapsed.
The burn down rate represents the ratio of time elapsed against allocated time.
Task progress reassessments
Progress on existing tasks currently underway can be reviewed and adjusted as needed. By clicking on the Plus button  an interface will open and show the current date as a reference for the reassessment, the estimated remaining time in the selected time unit, and an optional comment area for any remark.
Once the reassessment is accepted, it will impact the task by recalculating the progress percentage and adding a new entry to the timeline below, displaying the reassessment history for the selected task.
Additionally, tasks can be marked as completed by selecting the Task done button, which will set the task's progress to 100% immediately.
DEPENDENCIES
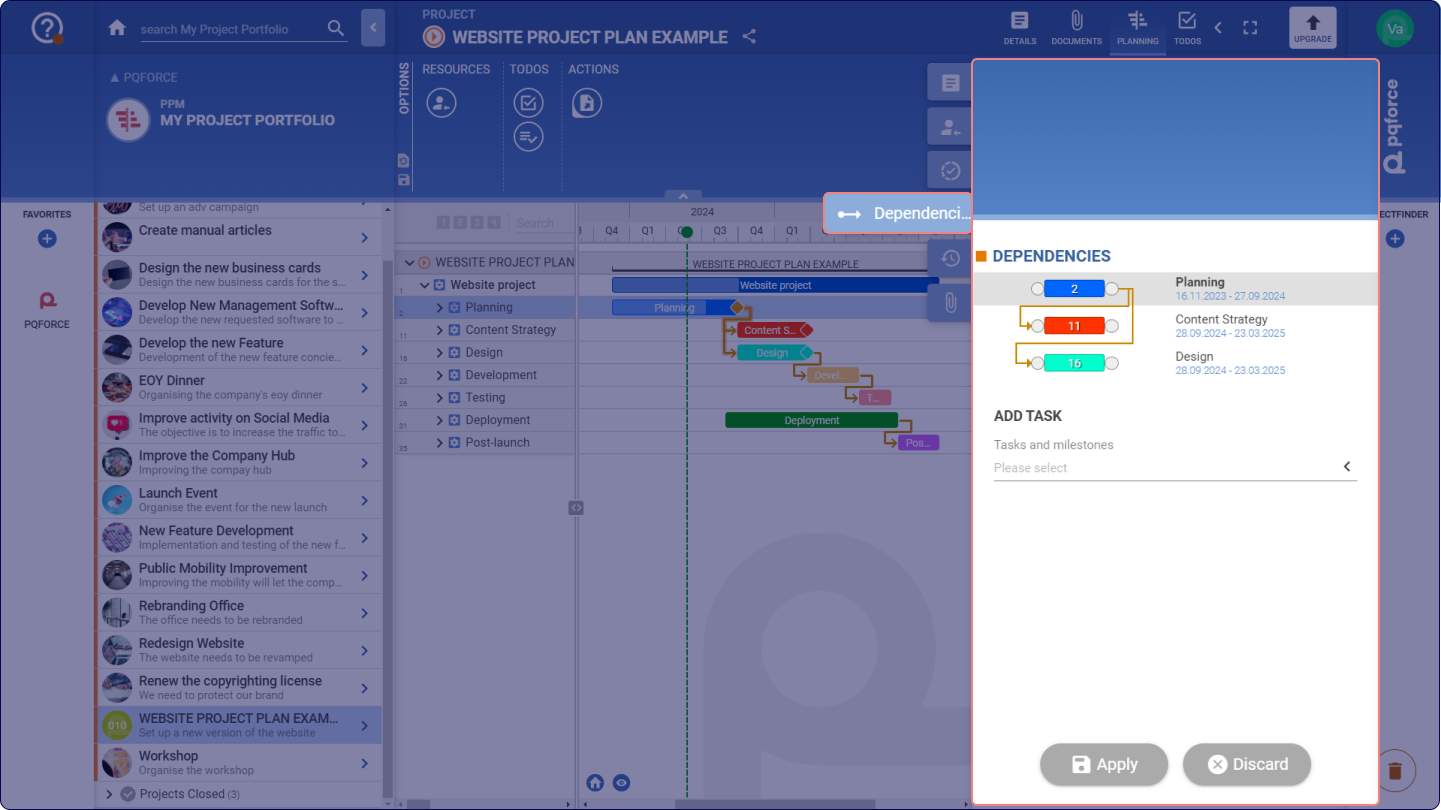
The Dependencies tab allows you to add dependencies to the currently selected task.
The dependency diagram displays the selected task, highlighted with a grey background, along with any existing dependencies associated with it, shown with a white background. Each task or milestone is represented by a corresponding bar or diamond, numbered based on its position in the work breakdown structure. On each side of every element, there are two grey dots, serving as handles for connecting tasks and milestones through drag and drop to create dependencies. On the right side, the names and dates of each element are displayed.
Creating a dependency
To add a new dependency in the Side Tab, select a task from the dropdown menu, which will then be added to the above graph. From there, the handles of a task can be dragged onto the start or end point of another one in the graph to connect them and create a dependency.
Editing a dependency
Clicking on the dependency arrow opens up a pop-up window, which allows to select Flexible, Solid or Custom option.
- Flexible adapts based on how you move tasks, shortening or extending the time between them if needed.
- Solid keeps the number of days fixed, no matter what changes.
- Custom lets you set a minimum and maximum range of days, making the dependency flexible but within a defined limit. Note that Custom can only be used if working without a working time model, i.e., when planning with calendar days.
LOGBOOK
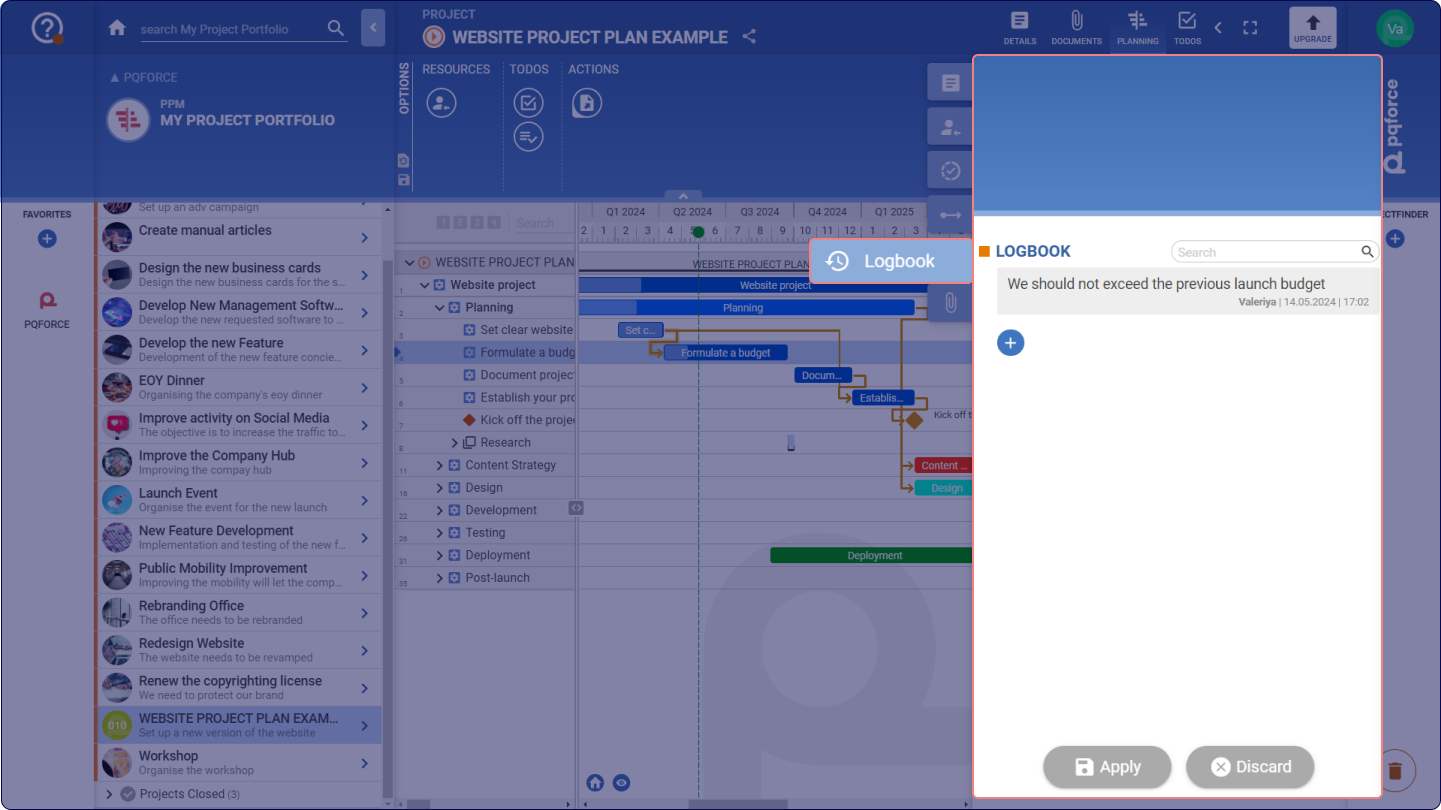
The logbook serves to input comments on a specific task, allowing users to maintain information and updates associated with it. Each logbook entry appears as a grey box and includes the entered comment, the name of the resource who authored it, and the date and time the entry was added.
Adding a Logbook Entry
To create a new logbook entry, the Plus button can be clicked. Enter the desired text, which can be formatted. Upon clicking the apply button, the entry will be saved and published on the selected task.
Deleting a logbook entry
To delete a logbook entry, it can be dragged and dropped to the trash can  .
Searching for a logbook entry
To search for a logbook entry, the search field located to the right of the LOGBOOK title can be used. Enter the desired text and press enter or click on the magnifying glass  icon to search through the comments and display the results.
Workspace
Project structure plan
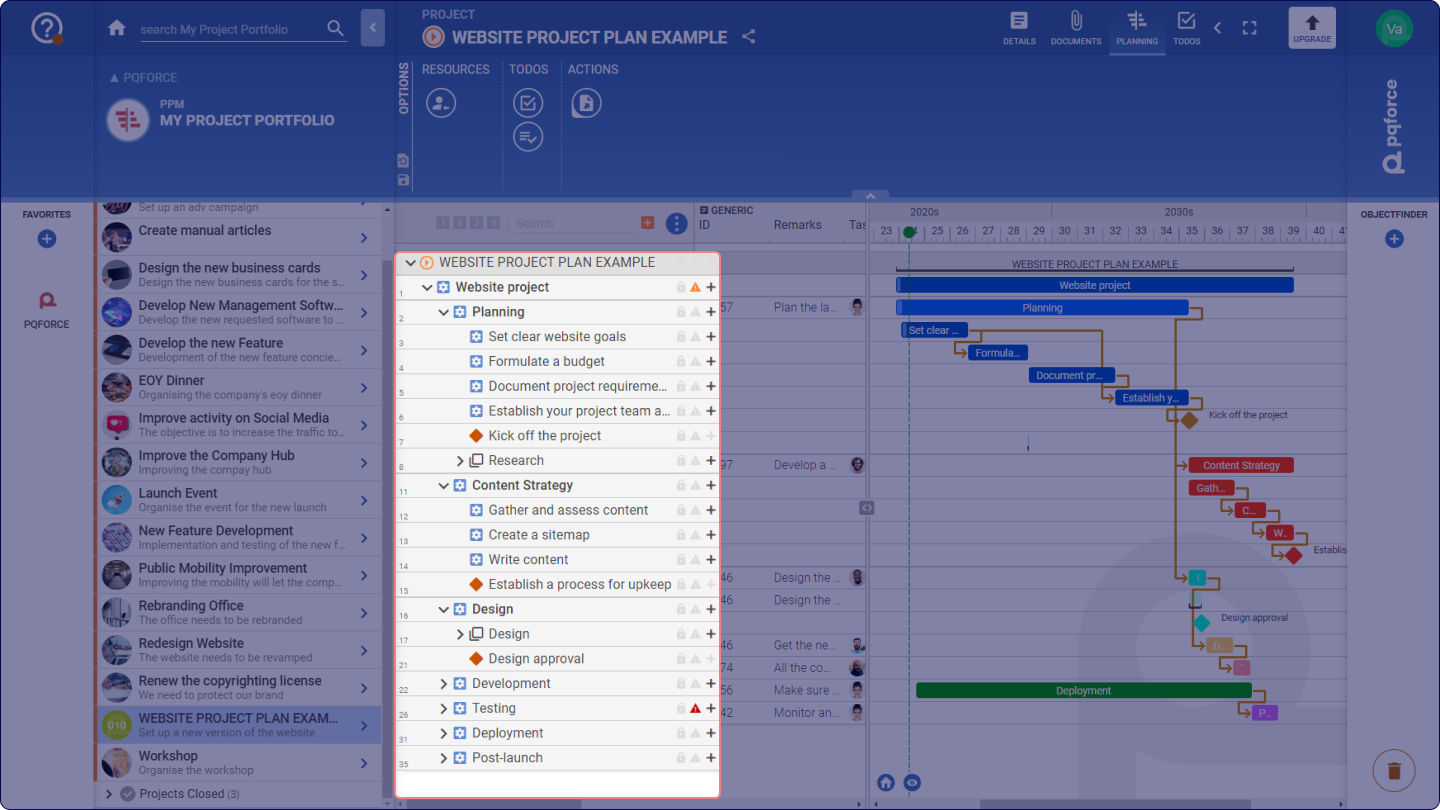
The work breakdown structure is the first column of the table and represents the hierarchical structure of the project. The entries in this column are the individual components of the work breakdown structure, the so-called structure elements.
In PQFORCE, a distinction is made between the structure elements task, milestone and folder. A folder is a container that can contain further structure elements, but is itself not limited in time. Folders are displayed as empty rows in the Gantt chart.
Folders and tasks can have further structural elements attached to them. If a task is attached to another task, it is called a subtask. Subtasks are located one level lower than the parent task. In this way, a hierarchical structure of tasks and subtasks can be created, which can have any number of levels.
The following section describes how the structure elements and thus also the work breakdown structure can be managed.
Setting the work breakdown structure level / task filter
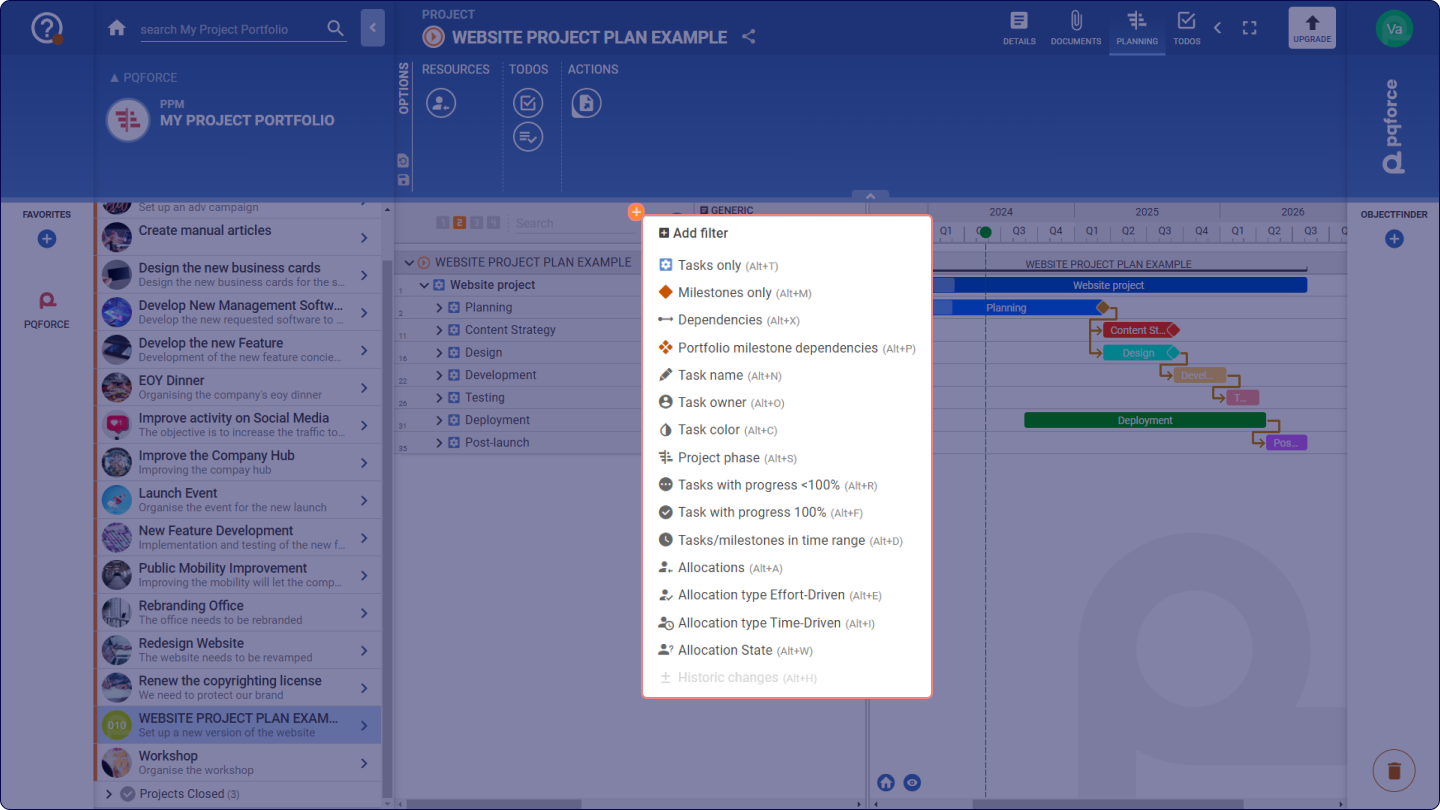
The level of detail can be determined at the top of the work breakdown structure. Click on one of the numbered boxes to display all structure items up to and including the corresponding task level. The level 4 will show all sublevels created.
Next to it there is a task filter with which the structure elements can be searched and filtered according to a search term. If you press one or more of the following key combinations when entering the search term, you can further filter the list of search results:
- ALT+T: Show tasks only
- ALT+M: Show milestones only
- ALT+X: Show dependencies only
- ALT+P: Show dependencies to portfolio milestones
- ALT+N: Task name
- ALT+O: Task owner
- ALT+C: Task colour
- ALT+S: Project phase
- ALT+R: Progress < 100%
- ALT+F: Progress = 100%
- ALT+D <from>-<to>: Filter by the time range entered between the <from> and <to> dates.
- ALT+A: Allocations
- ALT+E: Allocation Type Effort Driven
- ALT+I: Allocation Type Time Driven
- ALT+W: Allocation State
- ALT+H: Historic Changes
Create structure elements
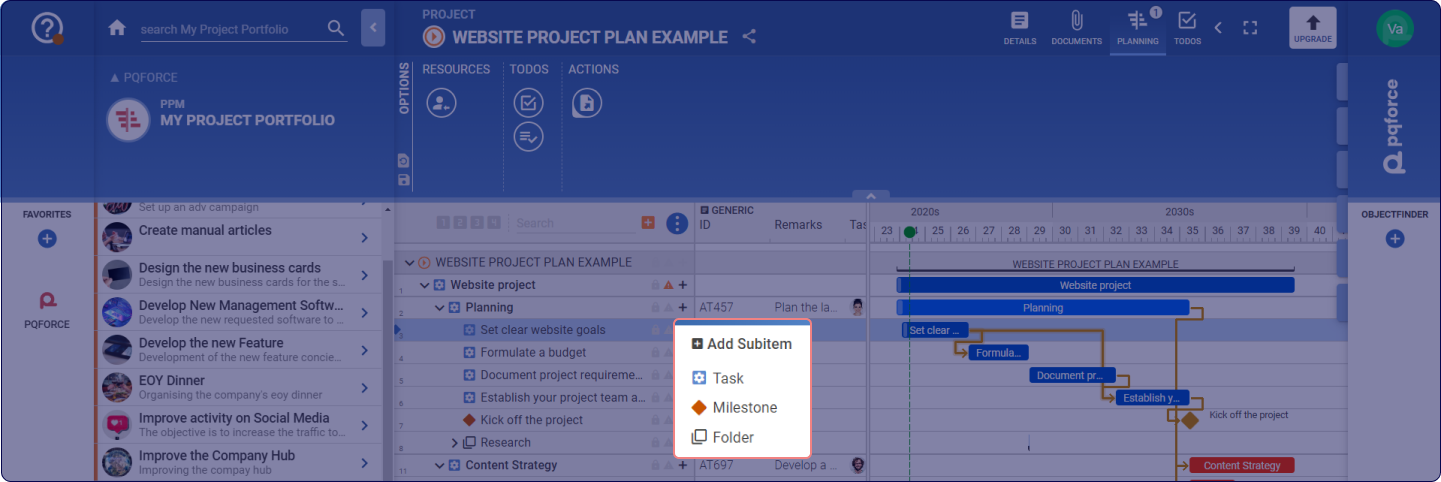
In the work breakdown structure there is a Plus icon  next to the name of each task and folder. By clicking on such a plus symbol, a small context menu appears, which allows the creation of a subtask, a folder or a milestone on the level directly below the one on which the command is executed.
If a subtask is created in this way, it will receive the start and end dates of the task closest above it in the hierarchy. However, if another subtask already exists at the same level, the newly created subtask is placed chronologically after the last existing subtask.
If a milestone is created in this way, it is given the start date of the task next above it.
Alternatively, subtasks can also be created by holding down the CTRL key on the desired task in the Gantt chart and dragging the area over which the subtask is to extend while holding down the left mouse button.
Milestones can also be created by holding down the CTRL key and clicking on the desired task in the Gantt chart at the point in time at which the milestone is to be located.
Move and copy structure elements
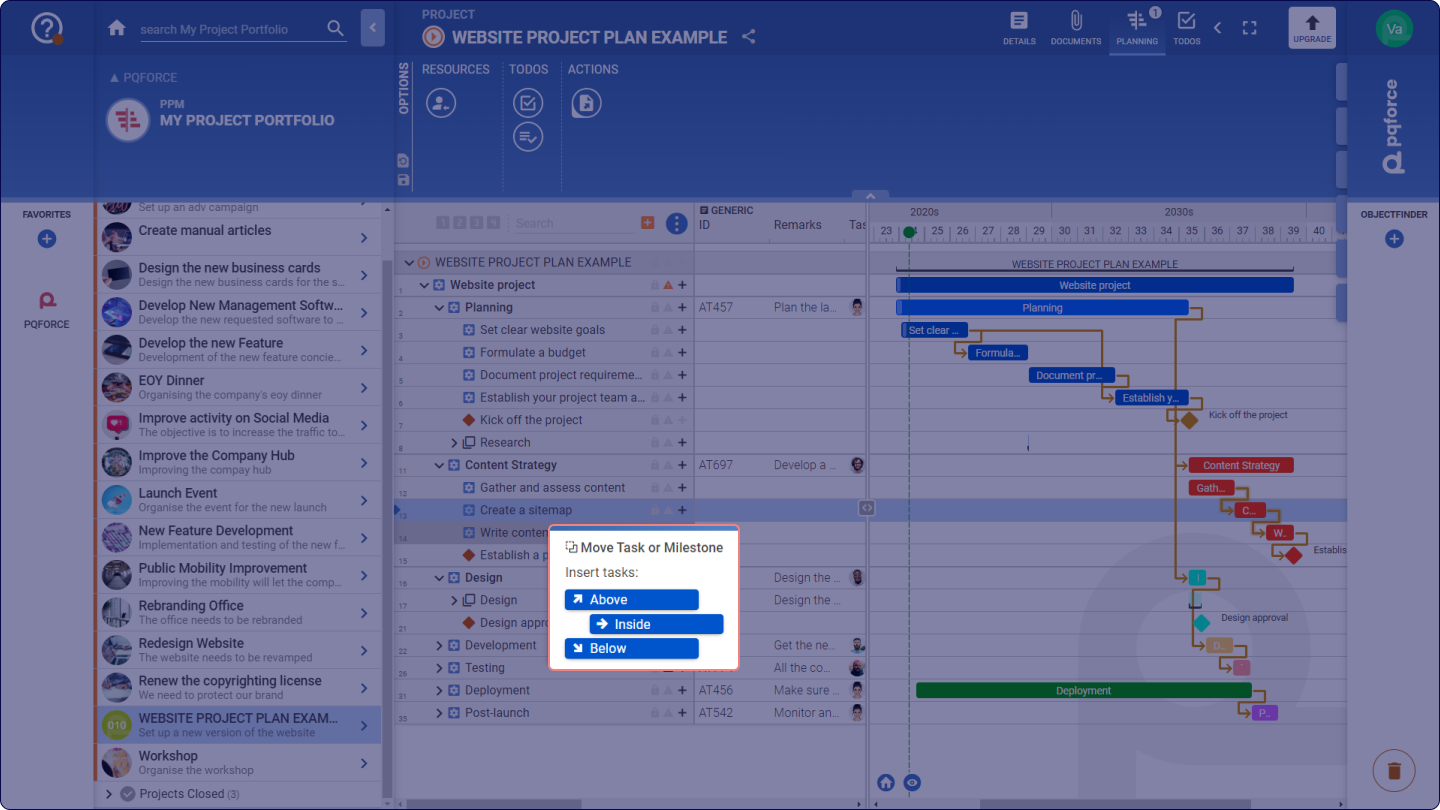
Move: A structure item can be moved to the name of another structure item in the work breakdown structure using Drag & Drop, which causes a Move Task context menu to appear.
The context menu offers the options Above and Below, which place the structure item either above or below the target item on the same task level. If the target element is a folder or a task, the option Within appears additionally, which places the structure element one task level below the folder or task.
If a task or folder is moved, all structure items attached below will be also moved.
Copy: If the CTRL key is pressed while moving, the mouse pointer changes, and the structure element is copied instead of moved.
In this scenario, the context menu that appears is the Copy Task menu, which includes additional choices determining which properties and elements of the task should also be copied.
Here are the options available during copying and their effects:
- Subtasks: Copies all structure items attached under the original structure item.
- Dependencies: Copies all existing dependencies to other structure items on the original structure item.
- Allocations: Copies all allocations on the original structure item.
- TODOs: Specifies whether TODOs on the original structure item should be copied. The next two options define how the TODOs are copied.
- Relations only: Does not create new TODOs but establishes relations with all existing TODOs on the original structure item.
-
Entire TODO: Copies all TODOs and their relations on the original structure item, creating new duplicate TODOs.
If a task or a folder is copied, all structure items attached to it will also be copied. In this case, the options during copying are also applied to all structure items attached underneath.
Delete structure elements
A structure item can be deleted from the work breakdown structure by dragging and dropping the name of the corresponding item to the trash can at the bottom right.
Edit multiple structure elements at the same time
All operations described above (move/copy/delete) can also be performed for several structural elements at the same time. To do this, the desired structural elements must be selected at the same time. This can be done by clicking on one or more other tasks with the CTRL key pressed after selecting a task, which adds them to the selection. If an already selected task is clicked with the CTRL key held down, it is removed from the selection again.
Alternatively, multiple tasks can be selected by SHIFT-clicking on another task after selecting one, which adds that task and all tasks in between to the selection.
If several tasks are selected at the same time, they can be moved, copied or deleted exactly as described above.
Table
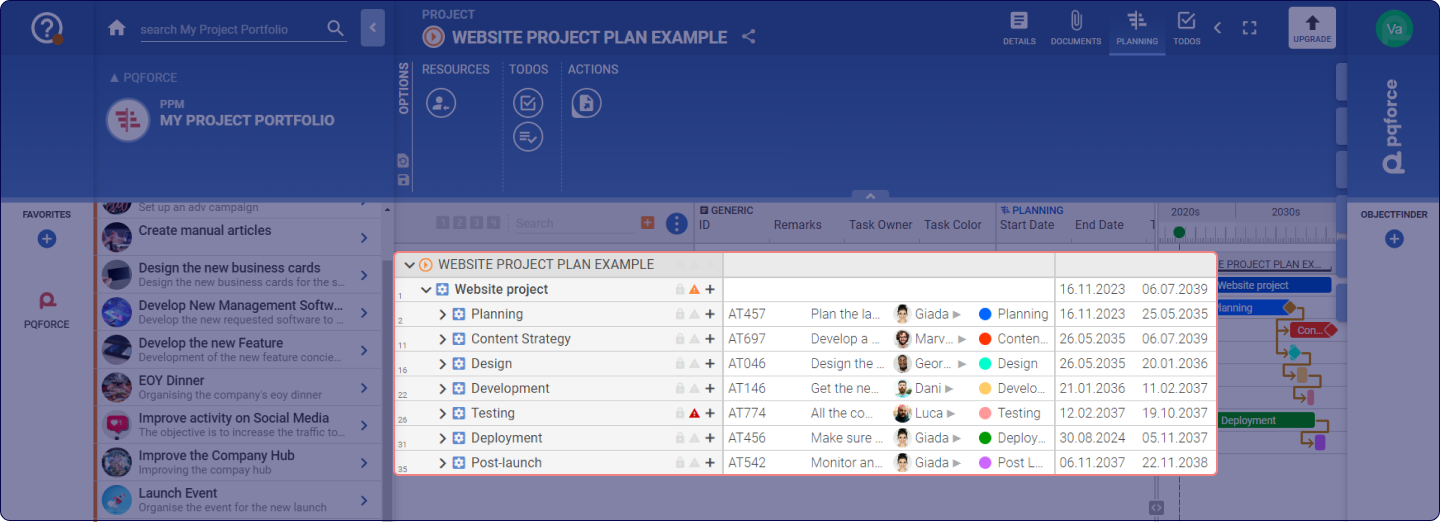
The middle part of the workspace is occupied by a table in which the properties of the structural elements are entered.
Column selection
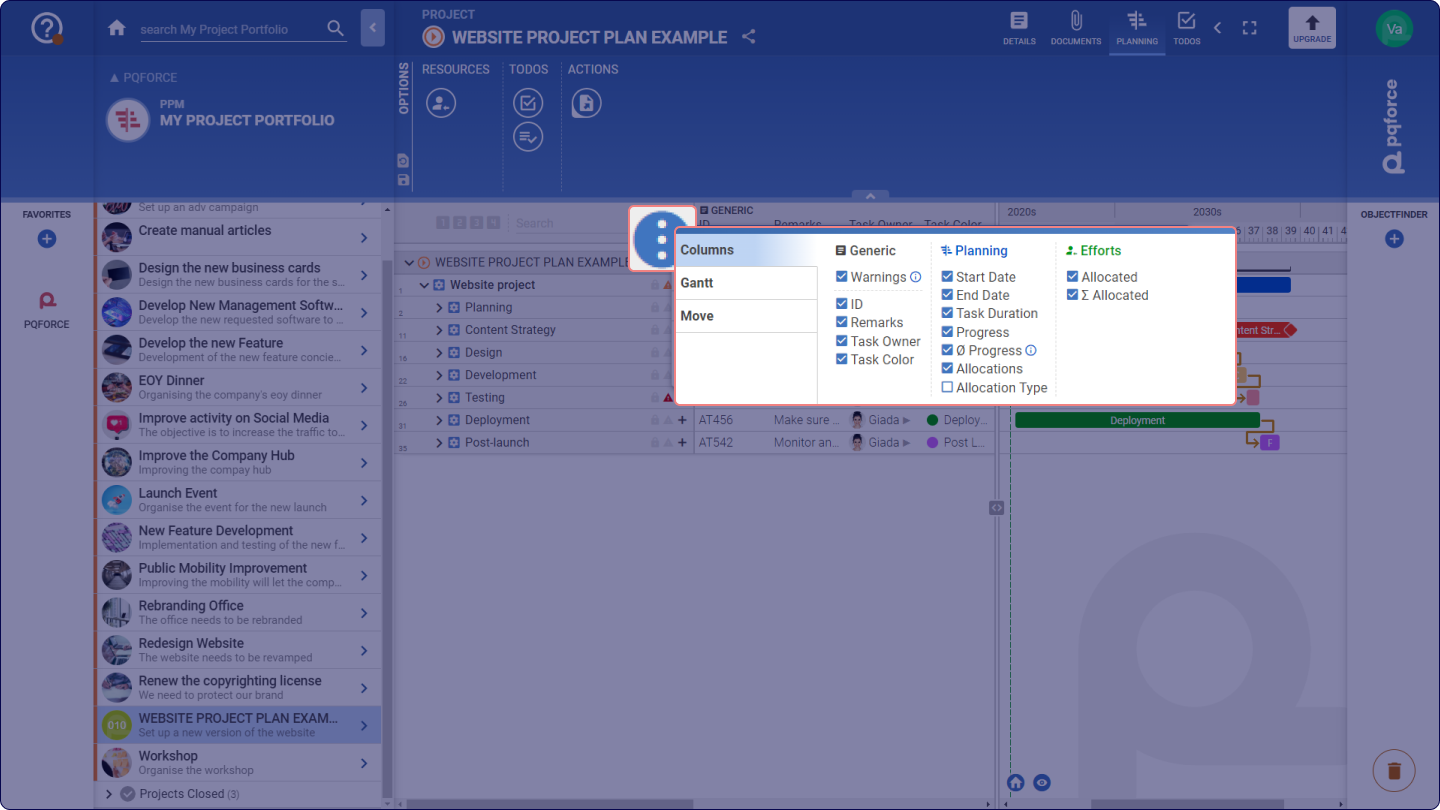
The displayed information depends on the displayed columns. The selection of columns can be modified in the Settings menu at the top of the work breakdown structure. The information is divided into different categories, in which there is a check box for each column. Columns are displayed in the workspace if their corresponding checkbox is enabled.
The Generic category contains the identification properties of the structural elements that come from the Side Tab.
The Planning category contains planning properties of the structural elements, which also come from the Side Tab.
The Efforts category contains data about the effort of the structural elements, which originate from the Side Tab as well.
Clicking on one of the category headings activates or deactivates all the checkboxes of the corresponding category.
Direct editing of table entries
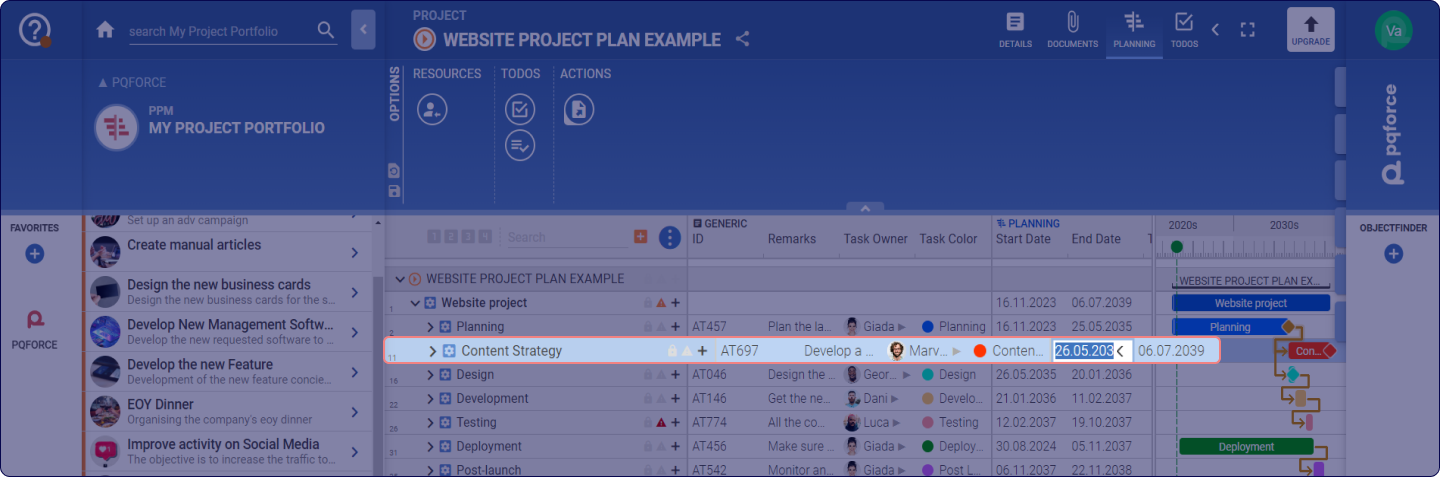
Most properties of structural elements are editable directly within the table. By double-clicking the desired cell the edit mode can be directly entered, allowing direct modification of the cell's value.
If there is a date or a value of a selection field in the cell, a dialog box can be opened by clicking on the arrow or pressing the down arrow key, in which a date or a value can be selected from the selection list.
Pressing ENTER confirms changes, while pressing ESC discards changes in the active cell, exiting edit mode.
If the value in the cell cannot be edited directly, double-clicking the cell will open the Side Tab where further values and properties of the corresponding structure element can be edited.
Note on direct editing in the table for task start and end data, and task duration:
- Changing task duration keeps the start date, adjusting the end date.
- Changing the end date keeps the start date, adjusting the task duration.
- Changing the start date keeps the task duration constant, adjusting the end date. This corresponds to a shift in the task.
Editing the start date in the table differs from editing it in the Side Tab.
Once a cell is selected for editing, TAB and SHIFT + TAB navigate to adjacent cells, while ENTER and SHIFT + ENTER navigate above or below. Alternatively, use CTRL + ALT + ARROW KEYS for similar cell navigation.
Gantt chart
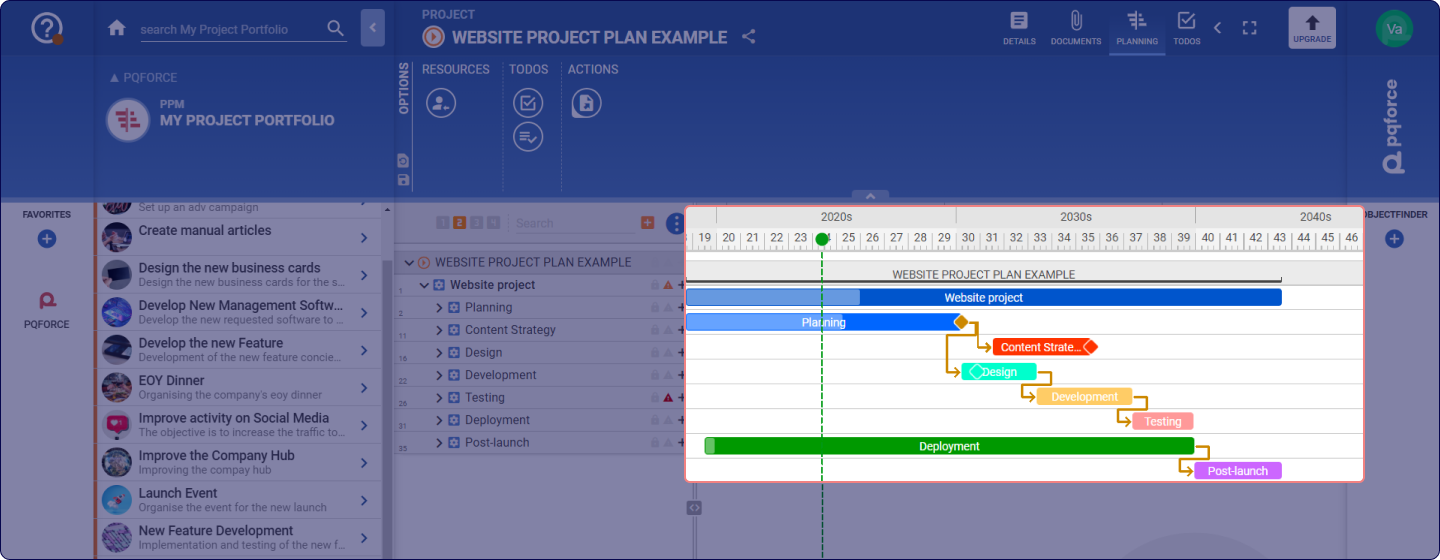
The right part of the workspace is occupied by the actual Gantt chart. This represents the processes in the project along a timeline and can be used directly to edit them.
Extend / reduce Gannt chart
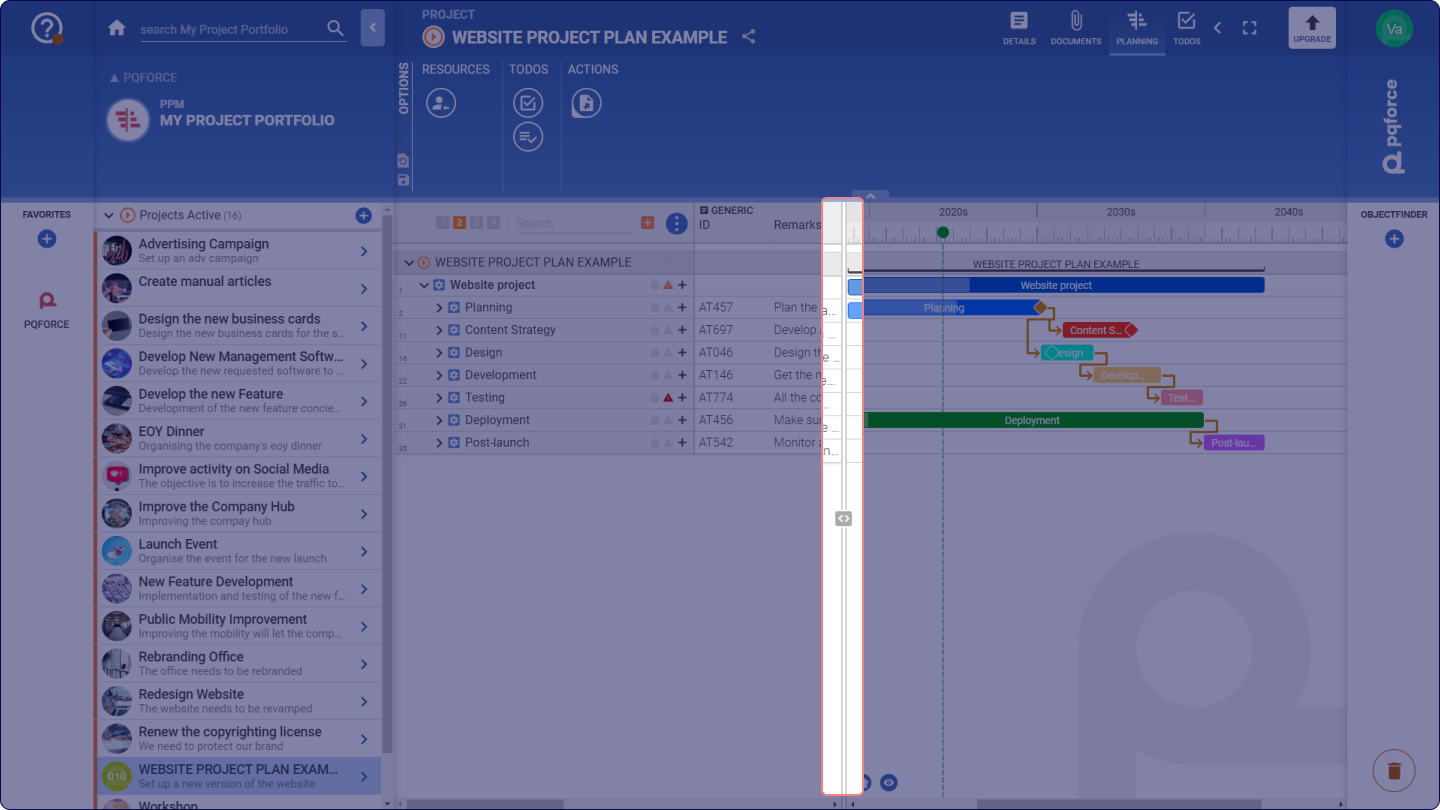
Between the table and the Gantt chart there is a slider. Using Drag & Drop, this can be moved to the left to expand the Gantt chart or to the right to reduce the Gantt chart. Alternatively, this can also be achieved if the mouse pointer is in the workspace and the mouse wheel is scrolled with the ALT key pressed. Conversely, operating the mouse wheel with the CTRL+ALT keys pressed causes the slider to snap to two predetermined points on the left and right.
Setting the displayed time range
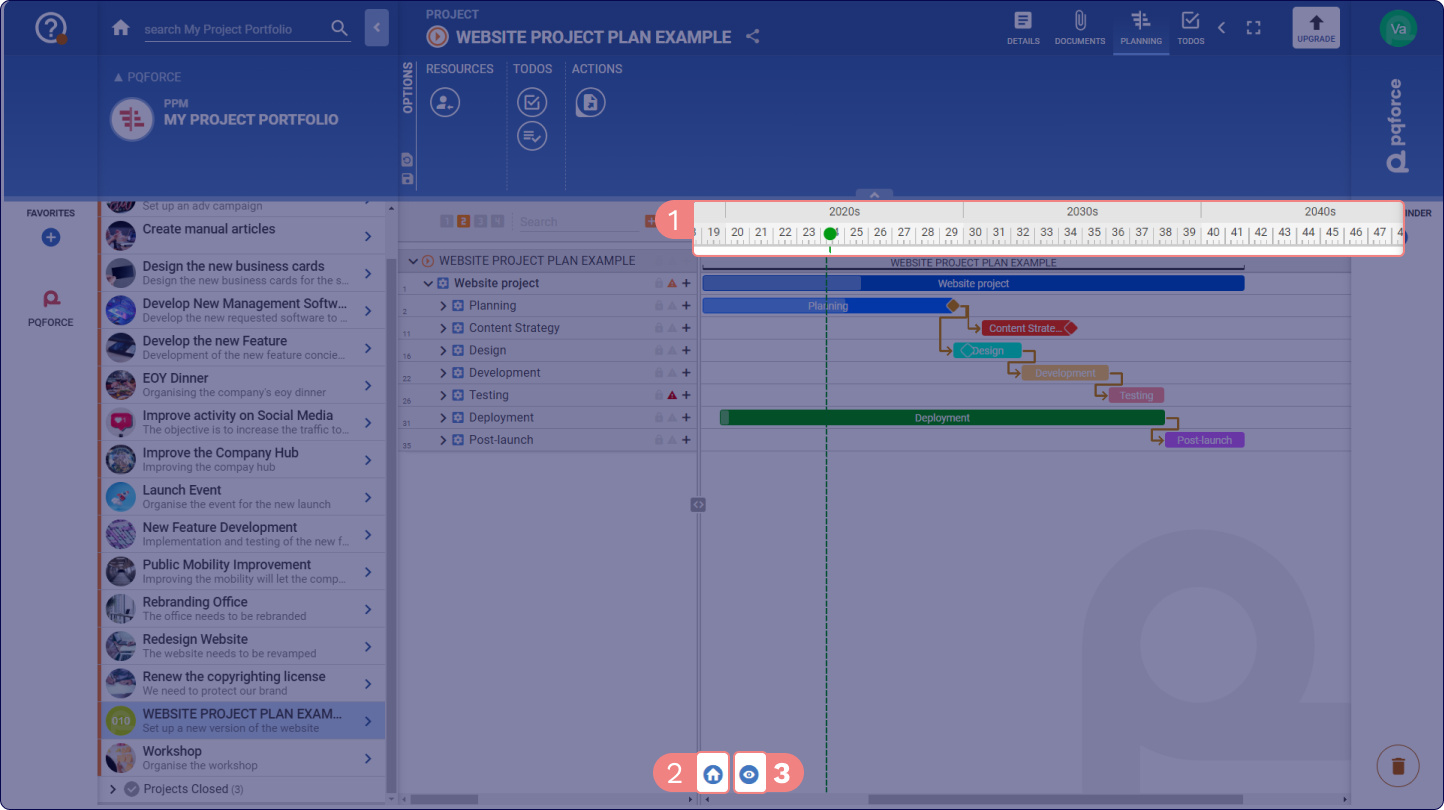
Above the Gantt chart, there is a time bar that covers the displayed time period. The time units adapt to the zoom factor of the displayed area. If the mouse pointer is over the Gantt chart, the zoom factor can be adjusted by using the mouse wheel while holding down the CTRL key, causing the time units on the upper time bar to scale smoothly.
The time can be visualized in days, weeks, months, or years. It is also possible to adjust the project time visualization by clicking on the Actions button at the bottom left corner of the workspace and using the zoom in/zoom out slider.
Using drag & drop, the displayed area can be moved both horizontally and vertically within the Gantt chart.
In editions higher than PQFORCE Smart, you can use the Earlier time section or Later time section buttons the displayed time range can be shifted to the left or right by its current length accordingly.
The Show entire project button selects the zoom factor and the position of the Gantt chart so that the whole project is visible from the beginning to the end in the displayed area.
The Actions button opens a menu in which a slider for the zoom factor and the following buttons are available:
- Go to today: centres the displayed area on today's date.
- Show portfolio milestones and non-project tasks: displays external dependencies, including tasks from other projects and portfolio milestones.
- Show Scale in Gantt: Shows or hides vertical lines along the current time scale.
- Show start/end dates in Gantt: Shows or hides start and end dates for each task.
Create tasks and milestones
Tasks can be created directly in the Gantt chart by dragging a time range on the desired parent task with the left mouse button while holding down the CTRL key. When the left mouse button is released, a subtask is created that spans the selected time range. If the time range is dragged up beyond the valid time range of the original task, the new task is created at the same level as the original task.
If a task is clicked with the CTRL key held down, then a milestone is created under the clicked task in the same way.
Time shifting of tasks and milestones
Tasks and milestones can be shifted in time in the Gantt chart by moving them horizontally to the right or left using Drag & Drop. During the move, the effects of the move on subtasks and dependent tasks are shown. The original positions of the affected tasks are marked with a drop shadow. If the Escape key is pressed during the move, the process is aborted.
The following key combinations can be used to activate a snap-in function which, when moving the task or milestone, fixes its start date along the upper timeline:
- SHIFT: Aligns the task or milestone according to the smallest time unit on the upper timeline.
- CTRL: Aligns the task or milestone based on the middle time unit on the upper timeline.
- CTRL + SHIFT: Aligns the task or milestone in accordance with the largest time unit on the upper timeline.
Move Task or Milestone
In the Settings menu, under Move, a rule can be set to dictate the behaviour of task movements, extensions, or contractions, as well as the relocation of milestones in the Gantt chart and their impact on subtasks and dependencies with other tasks and milestones. The following rules are available for selection:
- Task or milestone only: If this rule is active, only this task is taken into account when it is postponed, extended or shortened. The change therefore has no influence on subtasks or dependencies to other tasks or milestones and can therefore cause inconsistencies. The same applies to moving milestones.
- Consider dependencies: If this rule is active, when the task is moved, its subtasks are moved the same distance. Furthermore, all tasks and milestones to which the task has a dependency will also be moved, but only when the available margin over which the corresponding dependency has extended has been used up.
The Play animation checkbox determines whether a preview animation is played when a change is made to the Gantt chart. During the animation, the change can either be accepted (ENTER) or discarded (ESC) at the bottom right. The animation speed can also be set at 1x or 0.5x.
Set gantt visualisation
Within the Settings menu, under Gantt, customization options for chart visualisation are available. Users can select from the following colour schemes:
- Task Colour: Utilises colours defined in task details.
- Task Level: Hierarchically visualises tasks based on their position in the Work Breakdown Structure.
- Task Progress: Colors tasks based on their individual progress percentage.
- Critical Path: Represents the sequence of tasks crucial for completing the project on time.
Additionally, the progress bar visualisation can be configured to display:
- Individual task progress.
- Weighted average progress of the task and its subtasks, where allocations serve as weights.
Create dependencies
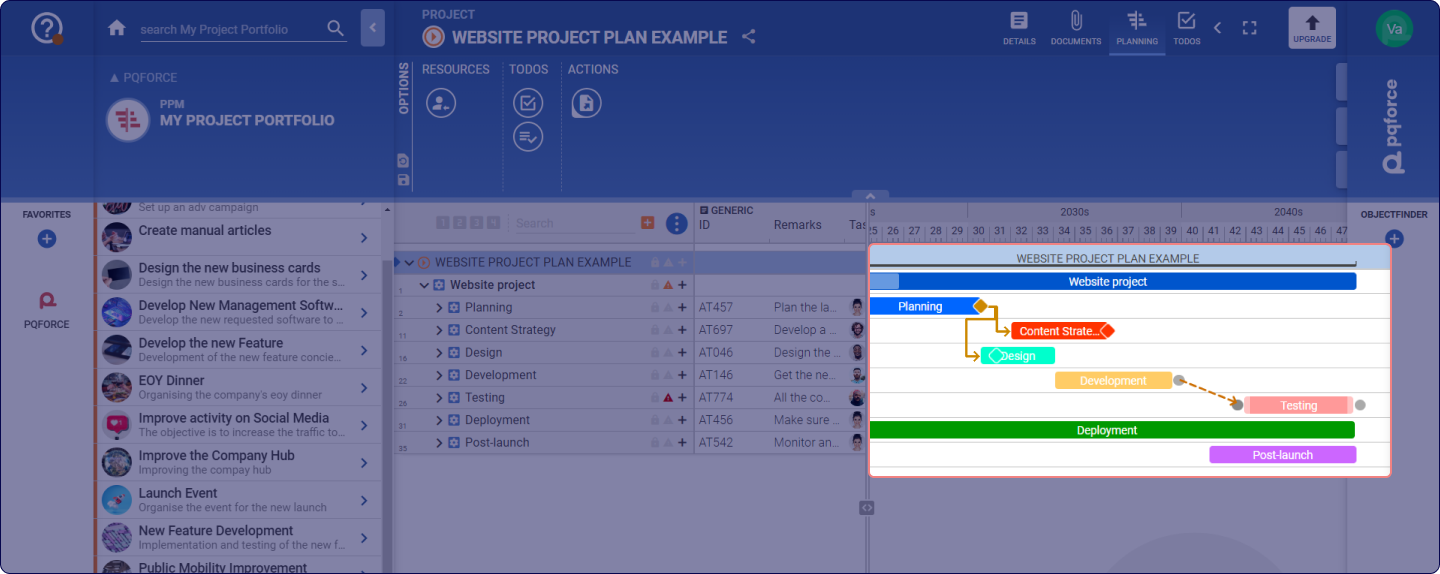
If the mouse pointer in the Gantt chart is on the same line as a task or milestone, a point appears to the left and right of this task or milestone respectively. By means of drag & drop starting from such a point, a dependency to a point on the left or right of another task or milestone can be created. Start-to-start, start-to-end, end-to-start and end-to-end dependencies can exist between tasks and/or milestones.
By setting in the setting menu at the tab Move a rule can be defined to move the target task automatically upon dependency creation if the new dependency creation is violated.
In editions higher than PQFORCE Smart, if global milestones are present in the overall project list that includes the active project, dependencies can be created between these global milestones and tasks and milestones within the project.
Editing dependencies
A dependency can be edited directly in the Gantt chart. This can be done by clicking on the dependency arrow. This action opens a dialog box in which one of the following dependency types can be selected:
- Flexible: This option allows the time interval between tasks to adjust automatically based on task movement. The system will either shorten or extend the time between tasks as necessary.
- Solid: This option maintains a fixed number of days between tasks, regardless of any changes to task duration or scheduling.
- Custom: This option permits the specification of a minimum and maximum range of days between tasks.
Note: The Custom option is only available when no working time model is in use or when planning is based on calendar days rather than working days.
Deleting dependencies
A dependency can be deleted by dragging and dropping it onto the Trash Bin at the bottom right corner of the screen.
Measuring points in time and time intervals
If the mouse pointer is in the Gantt chart, the time at which the mouse pointer is currently located can be measured on the upper time bar by holding down the SHIFT key, even if the mouse pointer is moved.
If a time segment is drawn with the left mouse button while the SHIFT key is held down, its start and end points are read out on the upper time bar, while the duration of the time segment is measured on the lower time bar.
Options Area
The following section describes in detail which settings can be made in the Options Area.
RESOURCES
Extends the view with possibilities for resource planning.
-
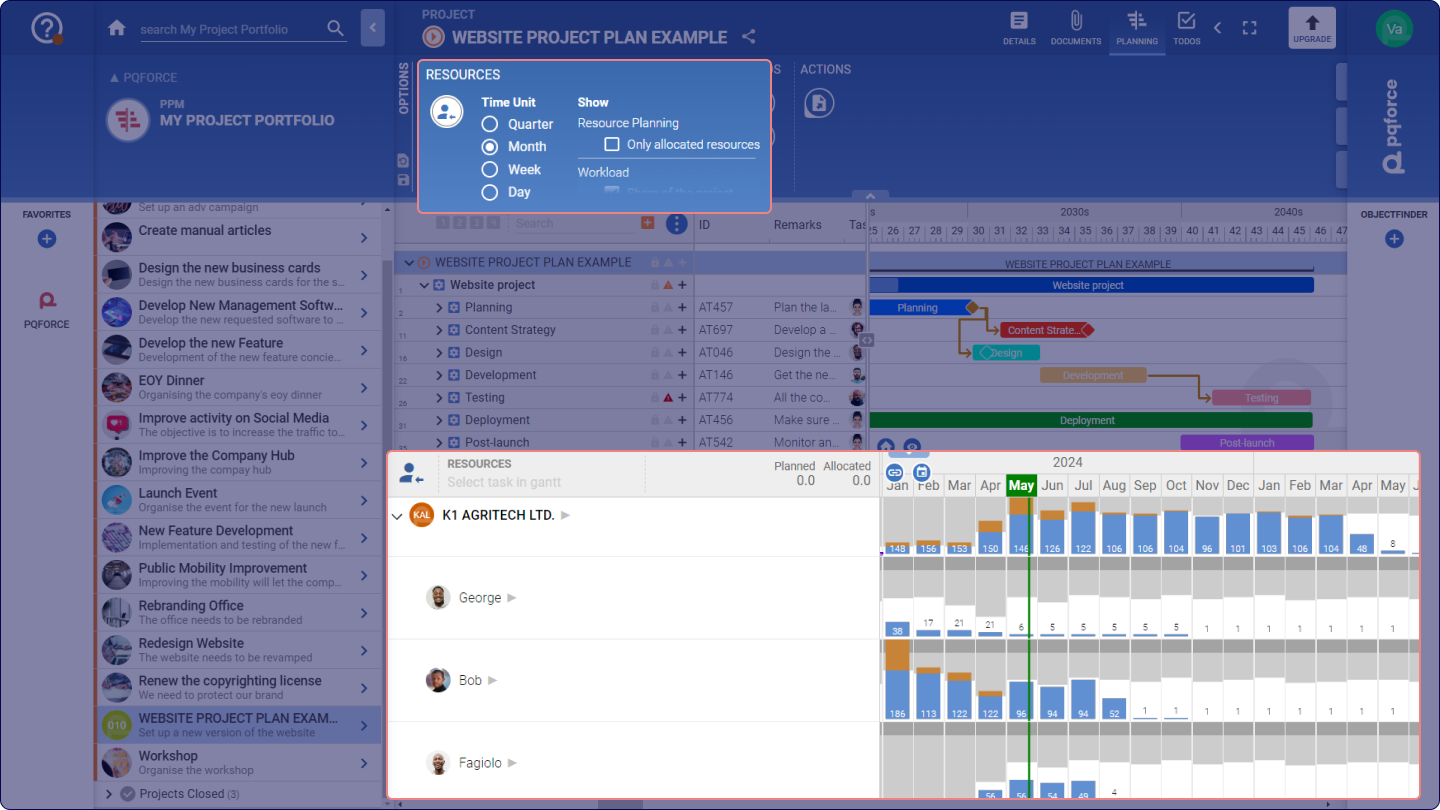
Plan resources: Opens in the secondary workspace a listing of the resources from the organisation chart and their workload diagrams.
In the left part of the secondary workspace are the resources from the organisation chart, structured with the same hierarchy. At the top, you can compare the planned effort for the task selected in the primary workspace with the sum of the allocated effort.
The right part of the secondary workspace contains the resource workload diagrams. Using drag & drop, the displayed area can be moved both horizontally and vertically when the mouse cursor is in the secondary workspace.
For a detailed explanation of workload charts, the article on WORKLOAD AND ABSENCES view can be viewed.
The features of this section may differ depending on your PQFORCE edition.
With the button Move and zoom the Gantt synchronously with resource planning the primary workspace is synchronised with the secondary workspace. The displayed time ranges and zoom factors are aligned so that when the displayed time range of the resource planning is moved, the Gantt chart is also moved and when the scaling of the resource planning is changed, the scaling of the Gantt chart is also adjusted accordingly.
The Go to today button centres the displayed area on today's date.
TODOs
Extends the view with options for TODO planning.
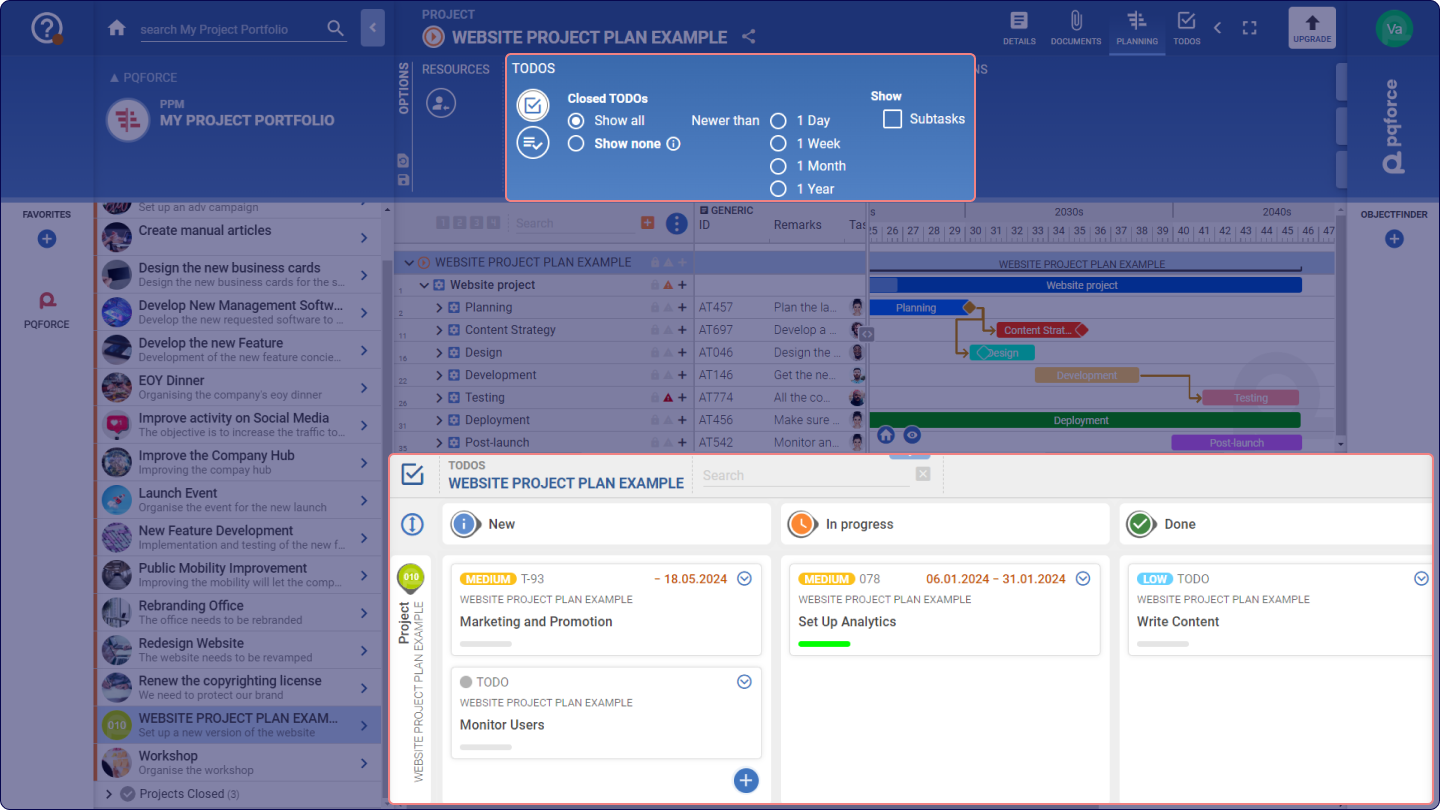
- Plan Kanban View: Opens the Kanban board in the secondary workspace, providing the capability to schedule TODOs within the project and its tasks. The first row on this Kanban board corresponds to the selected item in the primary workspace, while the second row displays all TODOs linked to the entire project.
- Plan List View: Opens the list view in the secondary workspace, which allows scheduling of TODOs in the project and its tasks.
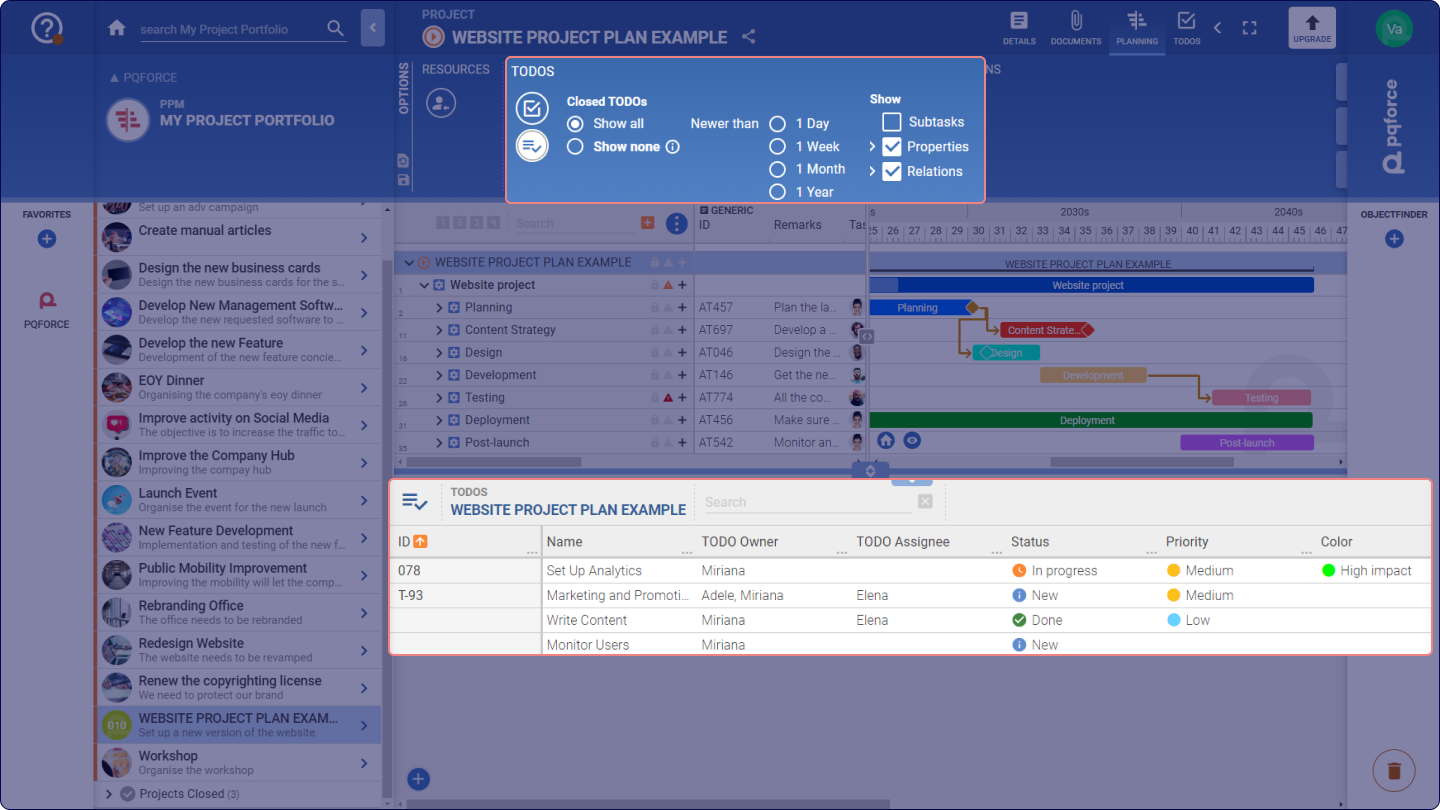
- Closed TODOs: Filters whether and which completed TODOs are displayed in the workspace.
- Show: These checkboxes can be used to determine which information is displayed in the secondary workspace.
- Sub-Tasks: If this checkbox is active, all TODOs that originate from all subtasks of the task selected in the primary workspace will also be displayed in the secondary workspace. In the Kanban board, these are displayed in an additional line.
- Properties: Contains attributes from the TODO tab in the Side Tab for a TODO and for comments or markers. This checkbox is only available when the list view is enabled.
-
Relations: Contains the relations a TODO can have to other objects in PQFORCE. This checkbox is only available when the list view is enabled.
For a detailed explanation on how to use Kanban board and list view, the TODO view article can be viewed.
VIEW
This section is available only for editions higher than PQFORCE Smart
Currency: Currency for the selected project can be defined here.
Working time model: Clicking on this icon opens a menu where it is possible to choose the most suitable model for the current project.
Two options are available when selecting a working time model.
- Project Default: This model is set as the default visualisation for all users within the project, ensuring consistency across the project.
- Preferred for me: This model allows you to set the working time model as favourite for yourself.
Once a working time model is selected, the system will only consider the designated working days when scheduling project tasks. Non-working days, including weekends and recognised bank holidays, will be visually highlighted in the Gantt chart according to the chosen model.
While users may continue to adjust task durations as needed, the system will restrict tasks from being scheduled to start or end on non-working days.
This change also affects the task duration displayed in the Details Side Tab, which will now reflect only the number of working days between a task's start and end dates, in line with the selected working time model.
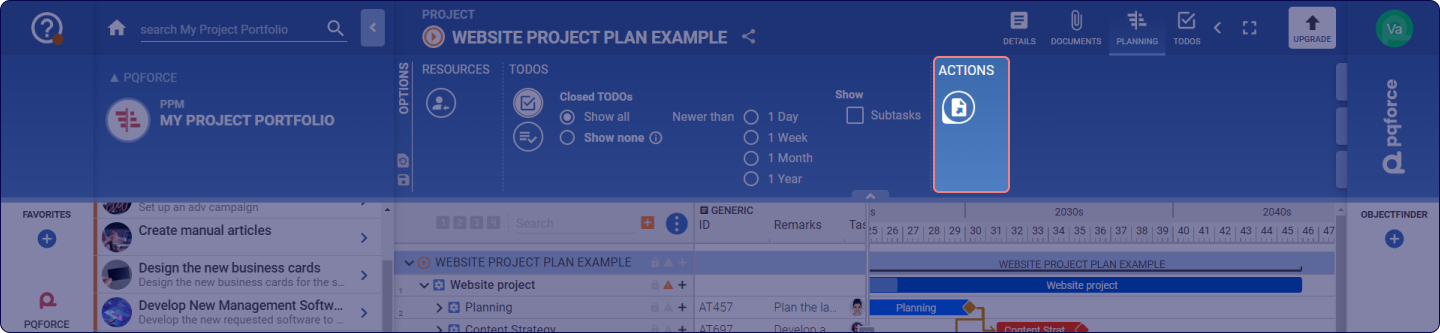
ACTIONS
Actions for the active view can be performed here.
-
Export: Here the currently displayed project list GANTT can be exported.