Workload and Absences
In this view, the total workload of the active resource and all resources that are subordinate to the active resource are displayed. Furthermore, the absences of the said resources can be planned here.
Workspace
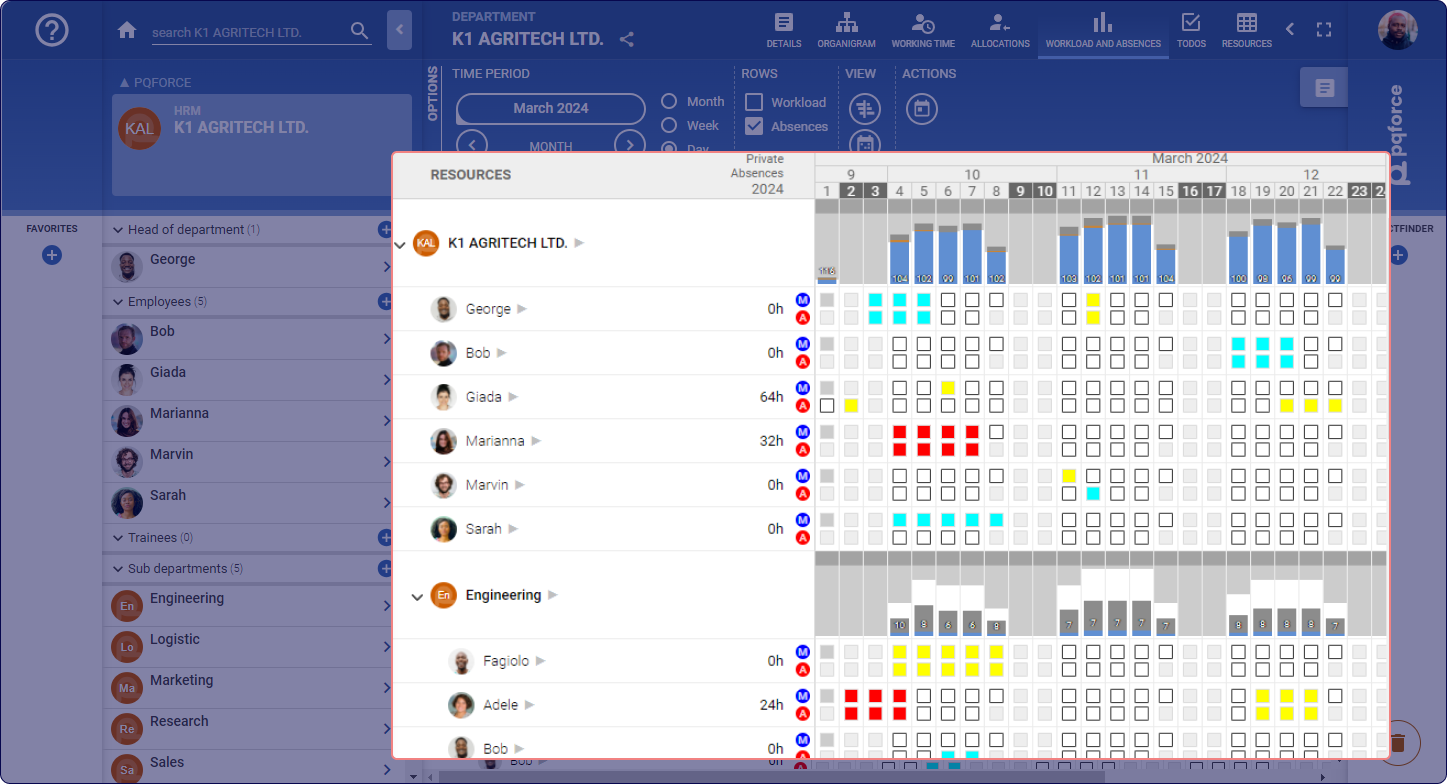
The workspace features a table where the first row represents the timeline. The first column displays the active resource and all subordinate resources. For example, if the active resource is a department, all its subdepartments are visible, allowing you to explore the organisational hierarchy.
Each resource's row contains workload diagrams, and for employees, absences can be accessed within this section.
Workloads
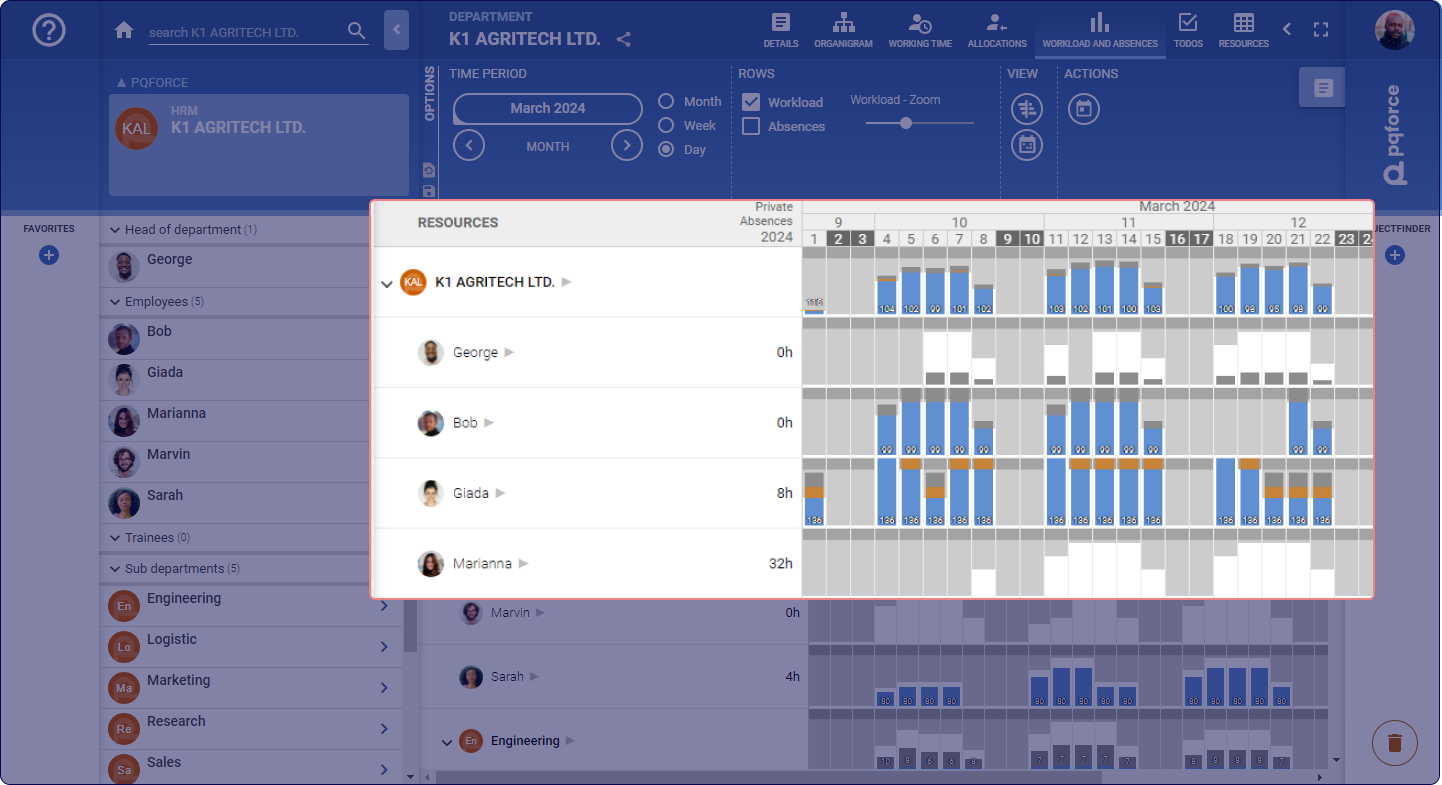
The workload diagram in PQFORCE utilises different colours to represent specific aspects:
- White bar: This bar in the background represents the effective availability of the resource. It is calculated based on the resource's work schedule, minus any base load and absences. For departments, it reflects the combined availability of all employees within the department.
- Light grey bar: Growing from the top, this bar in the background signifies the unavailability or absence of the resource. Together with the white bar, it reflects the theoretical availability of the resource according to its working time model. For departments, it represents the combined unavailability of all employees within the department.
- Dark grey bar: Positioned above the white and light grey bars, this background bar corresponds to the 20% of the theoretical availability and acts as a buffer for overloads.
- Blue bar: This foreground bar indicates the workload of the resource resulting from project allocations. For departments, it includes both the department's own workload and the workloads of all employees within it.
- Orange bar: Indicates overload, occurring when the blue bar exceeds the light grey area. If the overload surpasses theoretical availability, the orange bar extends into the dark grey area.
Absences
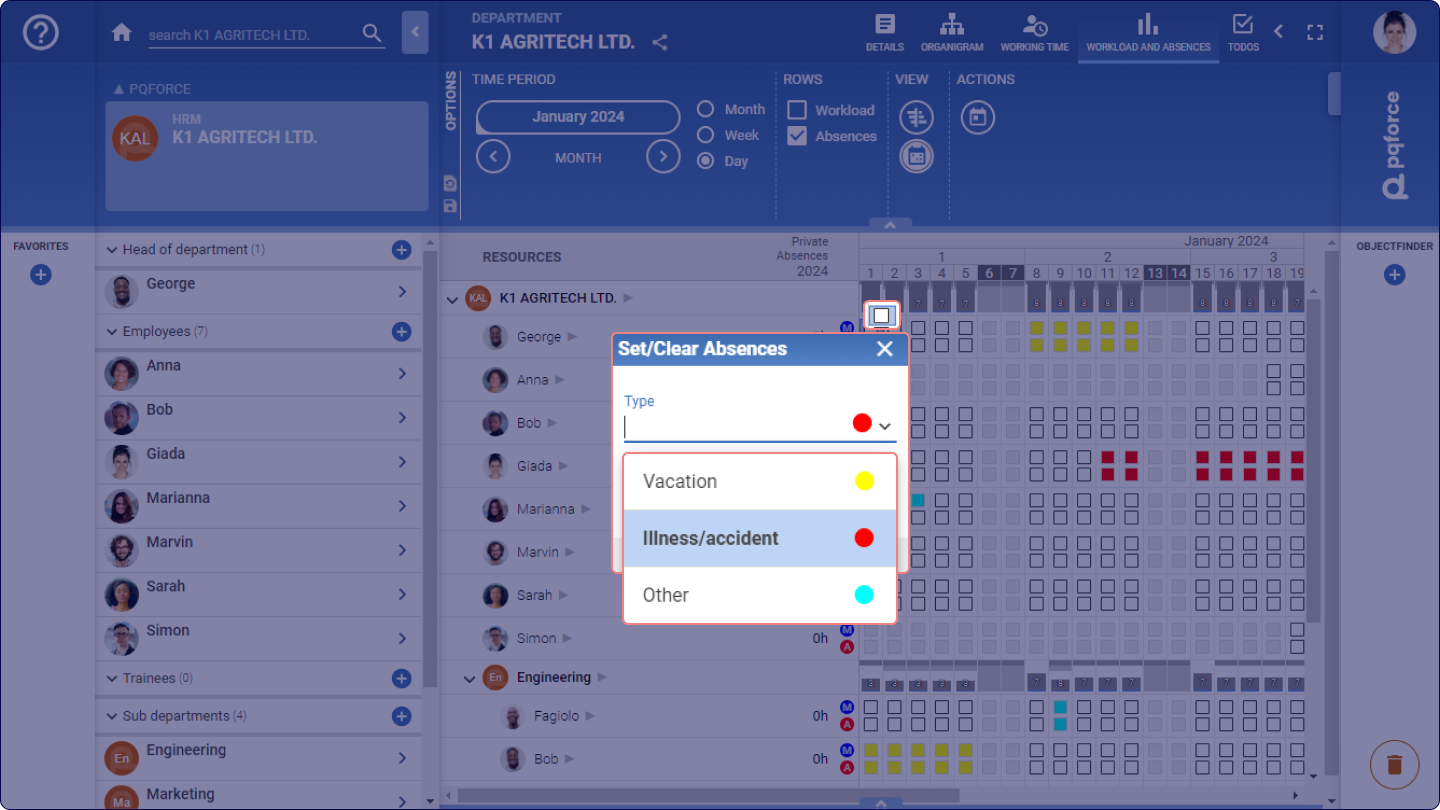
Absences may be recorded either through the Workload Chart or directly within the Calendar.
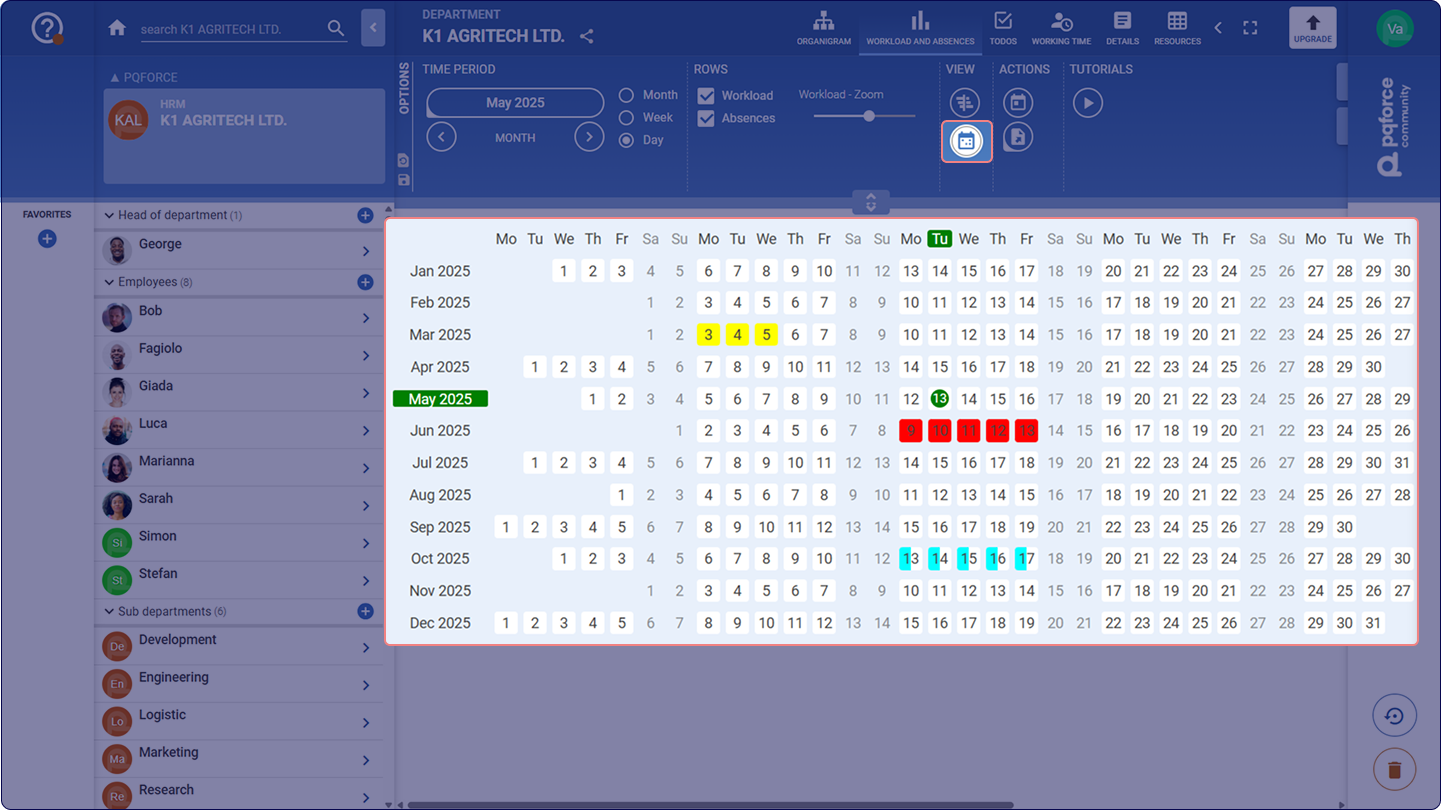
In the Workload Chart, each available shift is represented by a white box with a black border, aligned with the corresponding row for each employee resource. In the Calendar, each day is depicted as a white box indicating the specific day of the week, month, and year.
Clicking on these boxes opens a context menu, facilitating the entry of absences for the corresponding shift. By selecting an absence type and clicking OK, an absence can be entered, and comments can be added if needed. It is also possible to indicate whether the absence applies to the morning or afternoon shift; selecting both will register the absence for the entire day. To remove a previously recorded absence, users can click the CLEAR button.
Furthermore, the system supports the scheduling or removal of multiple absences simultaneously by enabling users to drag a selection rectangle across multiple boxes.
Planned absences are visually represented as coloured boxes, with each colour denoting a different absence type. An absence effectively reduces the availability for the corresponding shift to 0%, which is immediately visualised in the workload graph.
Holiday days and shifts in which a resource is not available, as per the working time model, are illustrated as greyed-out boxes. Although the availability is reduced to 0% for these shifts, absences can still be planned without affecting the workload diagram.
Options Area
The following is a detailed description of the settings that can be made in the Options Area.
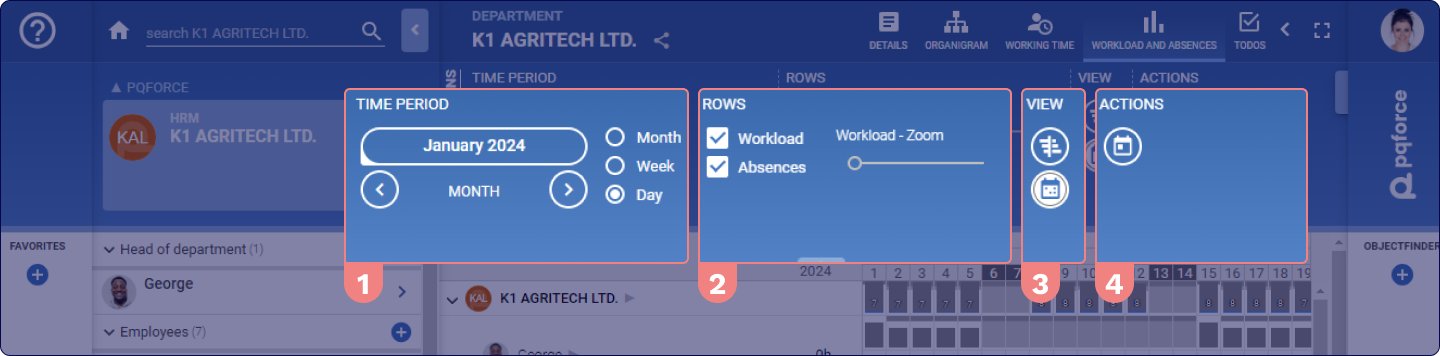
TIME PERIOD
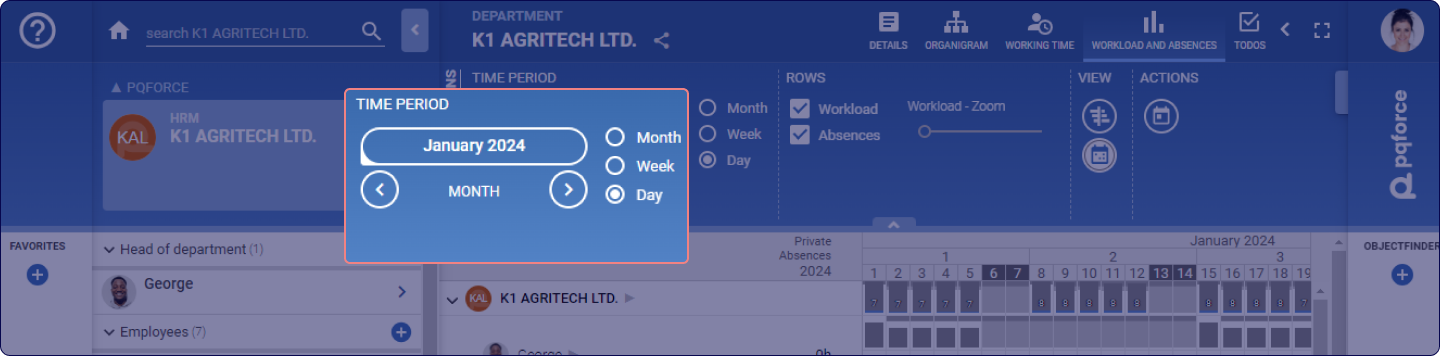
Determines the unit of the time axis of the workload and absence chart in the workspace. Options include month, week, and day, organised in ascending order of granularity. This setting also defines the pertinent time period for the workspace. Presets can be used to make the current month, the next month, the current quarter, or the next quarter visible. Alternatively, a specific time period can be specified by selecting a start date and an end date.
SCALING: For editions higher than PQFORCE Smart, the scaling setting determines the unit of the time axis of the workload and absence chart in the workspace. You can choose between month, week and day in ascending order of granularity.
ROWS
Determines what information is displayed in the workspace. At least one of the checkboxes Workload or Absence must be set.
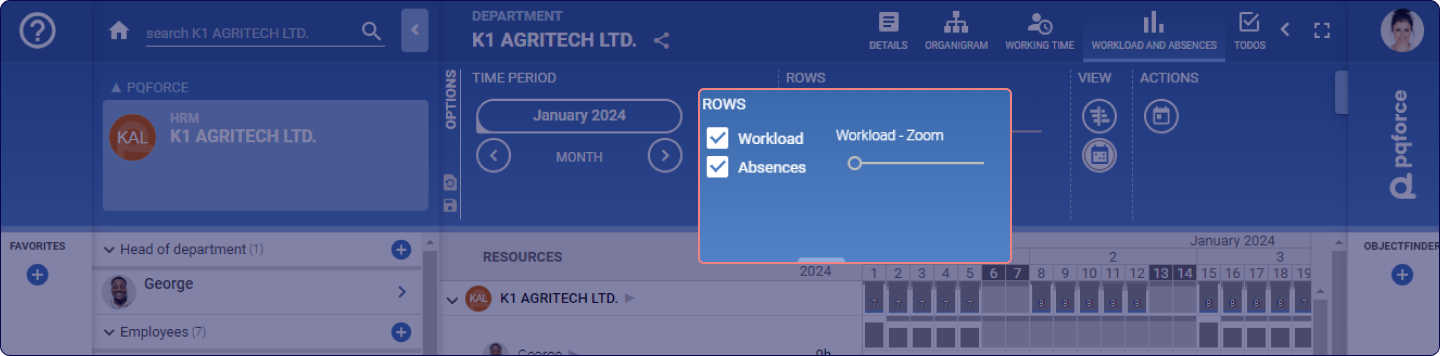
The functionalities and availability of this section may vary depending on your PQFORCE edition.
VIEW
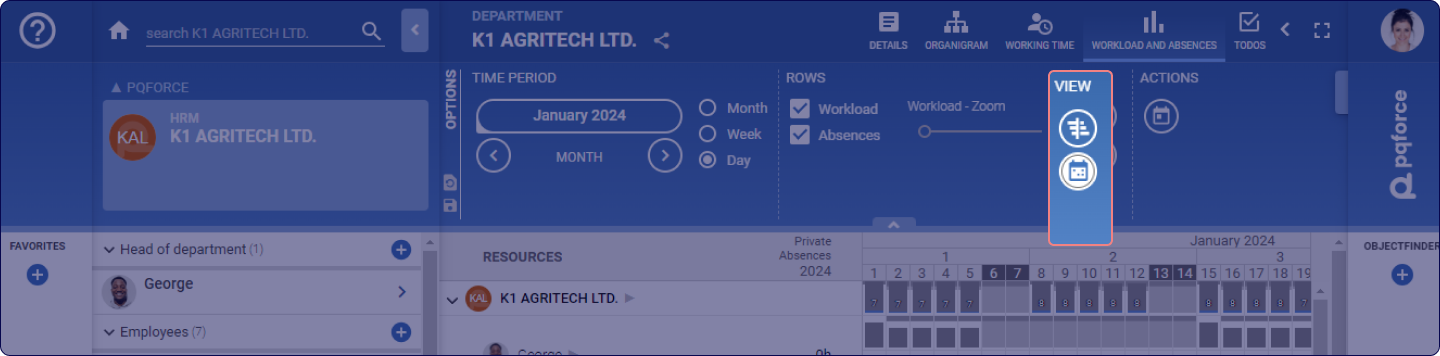
This section accommodates adjustments that expand or modify the active view.
-
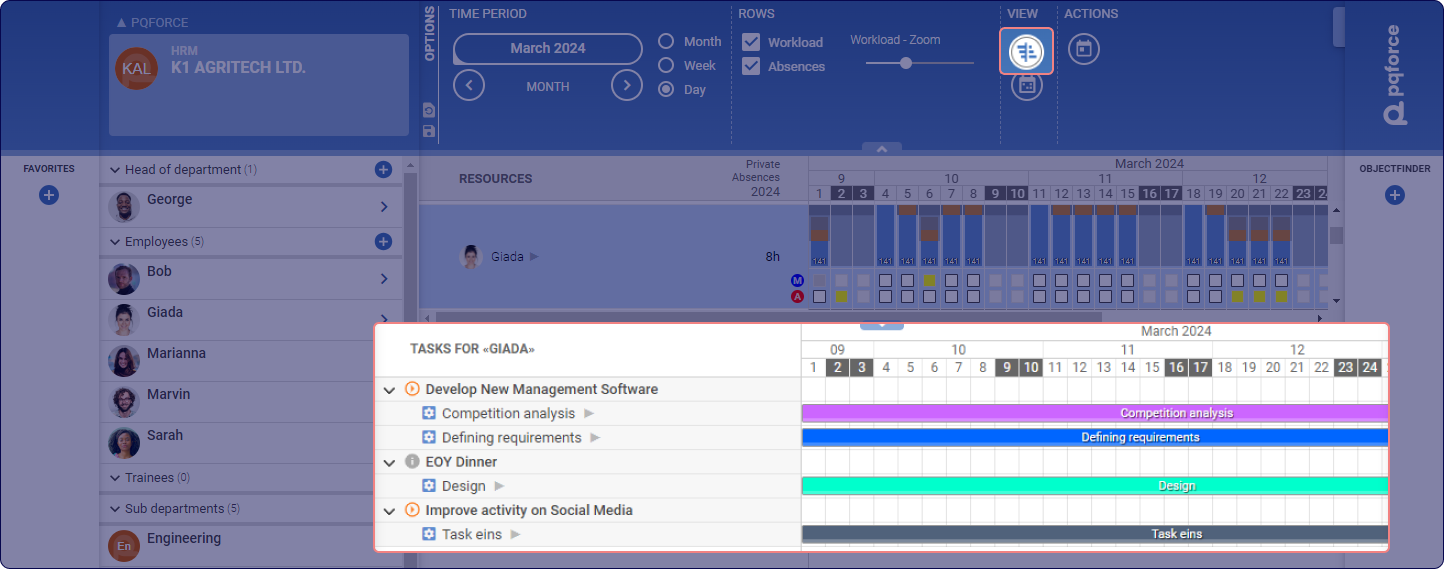
Show Gantt: Opens a Gantt chart in the secondary workspace.This visual representation illustrates the tasks and projects to which the active resource is assigned within the displayed time period. Selecting one of these tasks highlights it, enabling subsequent modifications to the task's details and allocations in the Side Tab, provided the necessary permissions are granted. In cases where there are multiple resources in the primary workspace, selecting one of these resources reveals the Gantt chart pertinent to the corresponding resource in the secondary workspace.
-
Calendar: Opens a calendar of the current year in the secondary workspace, in which all absences and holidays of the active resource are entered. In cases where multiple resources are present in the primary workspace, selecting one of them enables the visualization of their respective calendars. Alongside the calendar, detailed descriptions of absences and holidays are presented to the right.
ACTIONS
Actions for the active view can be performed here.
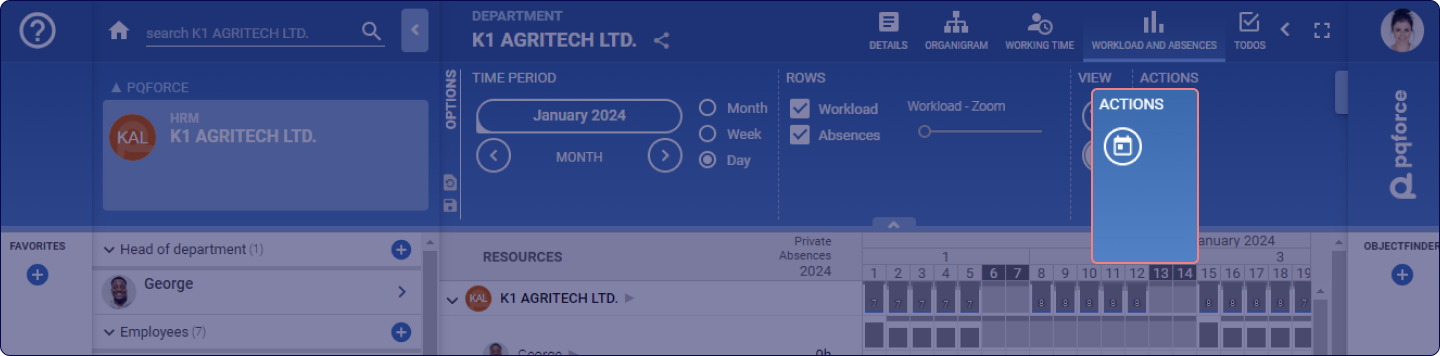
- Go to Today: Jumps to today's date on the timeline in the workspace. However, it requires that the time period specified under "Time Period" contains today's date.